
Figures & data
Table 1. Sample distribution by area and type of research covered in the interviews.
Figure 1. How and when SH participate in the research process according to the RG profiles.
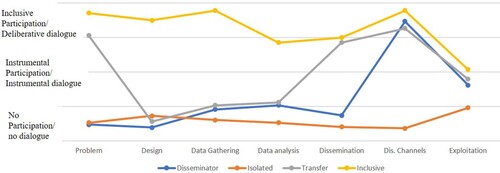
Table 2. Level of SH participation in each research phase for each researcher profile (according to the score on the indicators. Minimum value: 2. Maximum value: 6).
Figure 2. Scatter plot showing the distribution of the researchers, according to type of research and proposed dialogue type associated with their profile.
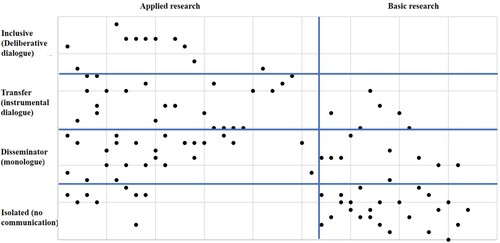
Table 3. Counting of RG according to type of participation and dialogue with SH.
Table 4. Potential strategies for improving the conditions for a deliberative dialogue.