
Figures & data
Table 1. Literature comparison.
Figure 1. The proposed supply chain.
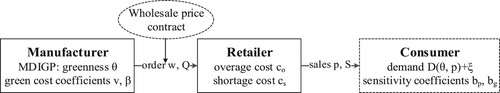
Table 2. Notations.
Table 3. Manufacturer’s optimal greenness and profit for DIGPs and MDIGPs.
Table 4. Baseline parameters.
Table 5. Optimal solutions under different demand settings.
Figure 2. Profits under negative distributions.
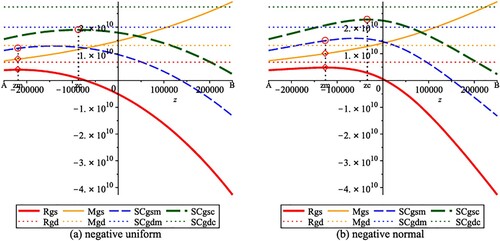
Figure 3. Profits under nonnegative distributions.
Notes: Setting a strictly positive lower bound yields similar properties to cases with zero lower bound, but has larger differences relative to corresponding deterministic solutions. Red circles mark the profits at optimal values of service levels under stochastic demand.
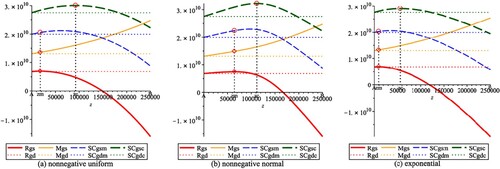
Figure 4. Wholesale price and profits comparison of decentralised and coordinated cases.
Notes: ‘wb’: the wholesale price in the bargaining game;‘wm’: the wholesale price under deterministic demand with decentralised decision-making;‘UC’: unit production cost under stochastic demand with centralised decision-making;‘Rb’ and ‘Mb’: the profit of the retailer and the manufacturer in the bargaining game, respectively.
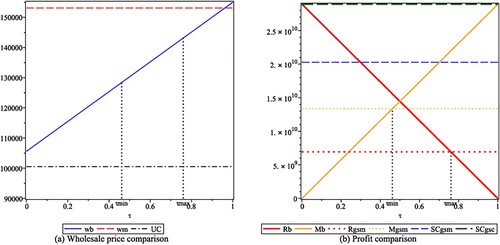
Figure 5. Impact of on optimal service level, greenness, prices, profits, and resulting ratios.
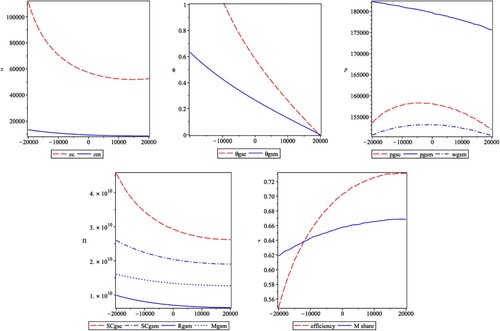
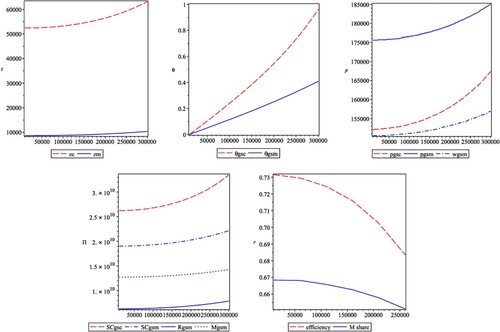
Figure 6. Impact of on optimal service level, greenness, prices, profits, and resulting ratios.
Supplemental Material
Download MS Word (526 KB)Data availability statement
Data sharing is not applicable to this article as no new data were generated in this study. The hypothetical data supporting the numerical analysis are available and analysed within the article.