
Figures & data
Figure 1. Travel economy of a truck for its various gross weights.
Source: Reproduced (Rahman et al., Citation2022).
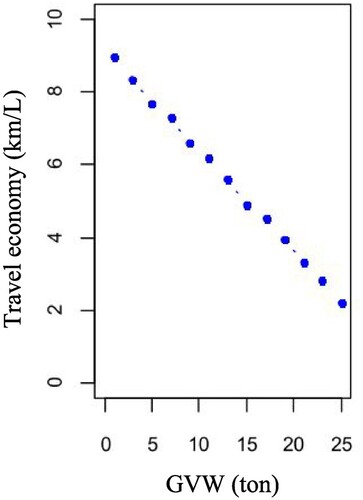
Figure 2. (a) The geographical locations of wholesalers (b) within the western region of Bangladesh.
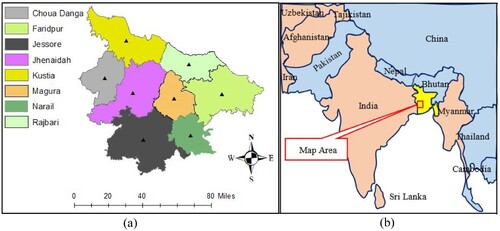
Table 1. Distance matrix.
Table 2. Weekly demands of the wholesalers.
Figure 3. The research framework.
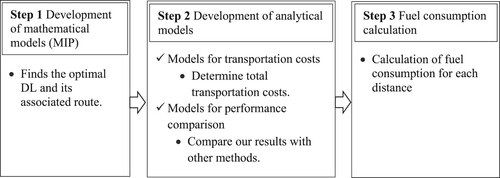
Table 3. List of parameters and decision variables used in mathematical modelling.
Table 4. Description of the variables.
Table 5. Fuel consumption matrix for the DL at FAR.
Table 6. Fuel consumption, travel route, and path distance for each depot.
Figure 4. Transportation routes in (a) nearest neighbour heuristic (b) sweeping heuristic and (c) Clarke & Wright's heuristic.
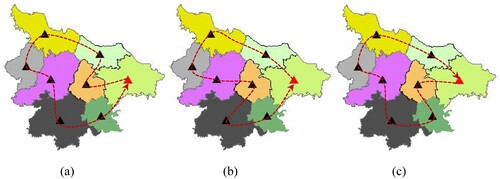
Table 7. Heuristics’ algorithms.
Table 8. Routes, path distances, and fuel consumptions for the heuristics.
Figure 5. Comparison of GVWs between (a) KUS and FAR, (b) KUS and MAG, (c) KUS and RAJ, (d) KUS and CHO, (e) KUS and JHE, (f) KUS and JES, and (g) KUS and NAR
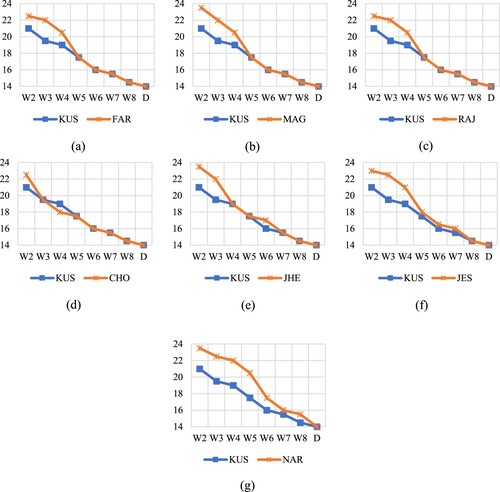
Figure 6. Fuel consumption comparison for each DL and heuristic method.
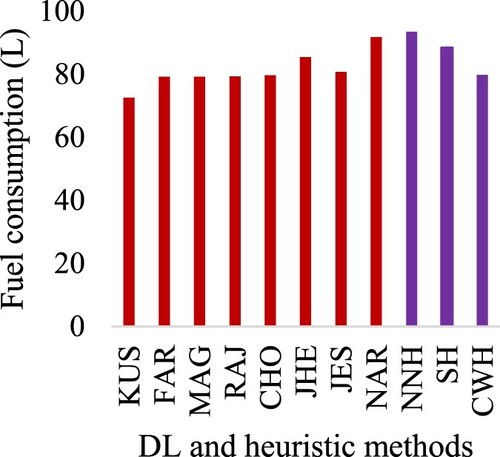
Table 9. Various quantities of loads (tons) are to be delivered to the wholesalers for different instances.
Table 10. Fuel consumption for each depot in various instances.
Table 11. Optimal DL for each instance.
Table A1. The distance matrix for the DL at KUS.
Table A2. The fuel consumption matrix for the DL at KUS.
Data availability
The authors confirm that most of the data is available within the article, and the remaining data used in the OPL CPLEX 22.1.1 will be available on request.