Figures & data
Table 1. Overview of case study areas.
Table 2. Overview of research participants.
Figure 1. The three phases of the COVID-19 pandemic for SNHSOs (March-September 2020).
Source: Reproduced from Dayson et al, Citation2022
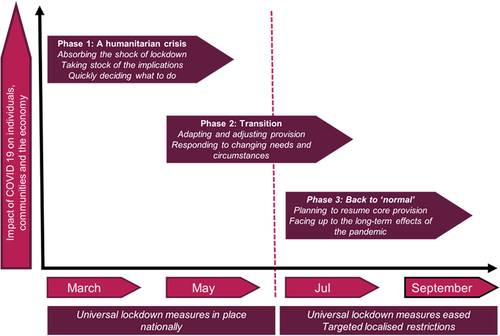
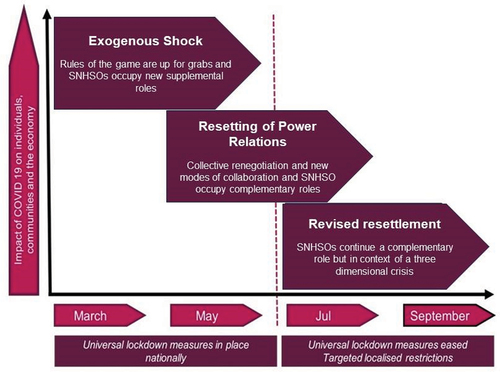
Figure 2. The evolution of SNHSOs-state relations during the COVID-19 pandemic (March–September 2020).
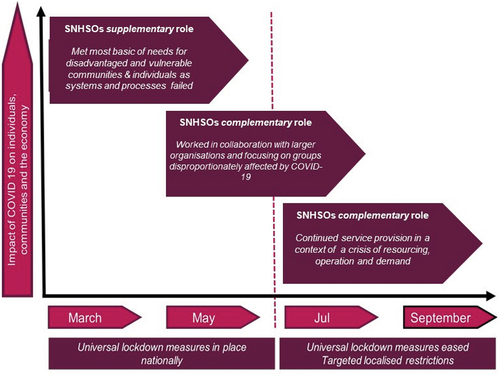
Figure 3. Conceptual framework of evolving SNHSOs-state relations as strategic action fields during the COVID-19 pandemic.