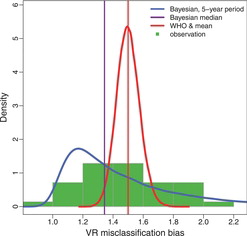
Figure 1. Observed and estimated VR misclassification biases. Histogram of observed VR misclassification biases and density functions for the WHO and Bayesian VR adjustment for a five-year observation in a country with no external information on the VR misclassification error.
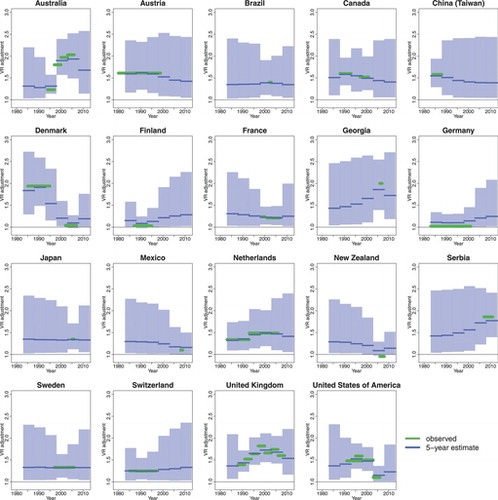
Figure 2. Observed VR adjustments and Bayesian estimates for countries with external information on VR misclassification biases. The green line segments represent the observed VR adjustments. Bayesian posterior median estimates for the VR adjustments for five-year periods (the default periods used in the WHO modeling approach) are added in blue and blue shades represent 95% credible bounds. The line span corresponds to the observation period.
Table 1. Prior distributions and posterior estimates for the Bayesian VR adjustment model
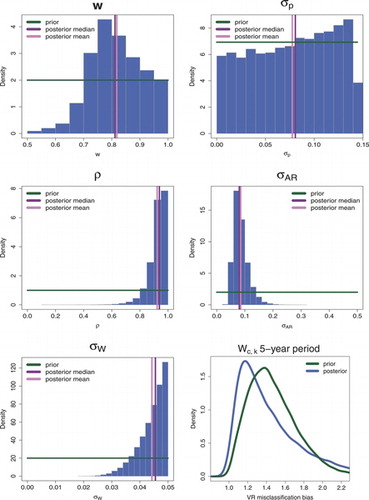
Figure 3. Prior and posterior distributions of VR adjustment model parameters. Posterior samples are displayed in the histogram. Priors are denoted by the horizontal green lines. Posterior medians and means are represented in the vertical purple and pink lines respectively. Wc, k refers to the VR adjustment for a five-year observation in a country with no external information on the VR misclassification error.
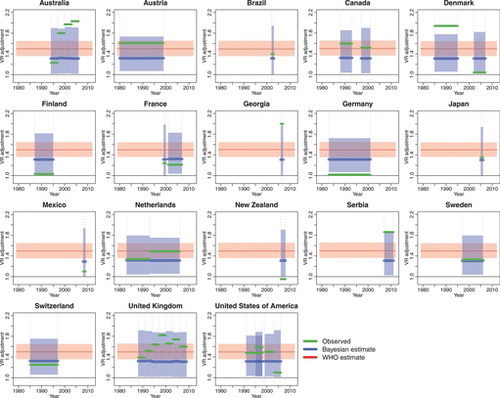
Figure 4. Point estimates and uncertainty bounds for VR adjustments for countries with external information that would have been obtained if the Bayesian and WHO approaches for countries without external information would have been used. Light green lines indicate observed VR adjustment factors. Blue lines and shades indicate the corresponding “no-external-information” Bayesian posterior median estimates and 95% credible intervals respectively. Red lines and shades indicate the “no-external-information” WHO mean estimates and 95% uncertainty bounds. The line span corresponds to the observation period.
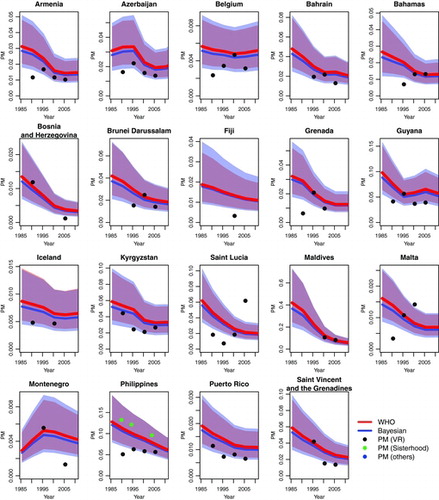
Figure 5. Maternal mortality (PM) estimates and 95% credible intervals for selected countries based on the WHO model (red) and the WHO model with Bayesian VR adjustment estimates (blue). Observations are displayed by source type. The selected countries are the countries with VR data but without external information on the VR misclassification, for which the WHO used a multilevel model for constructing PM estimates. The estimates from the WHO model with Bayesian VR adjustment estimates are referred to as “Bayesian.”
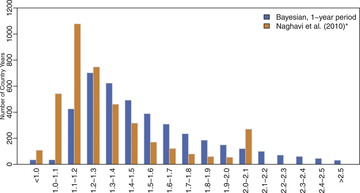
Figure 6. Comparison of VR misclassification values from Naghavi et al. (Citation2010) and the Bayesian VR adjustment model. The Bayesian estimates are based on one-year observation periods. *Values greater than 2 were aggregated in the Naghavi et al. results.
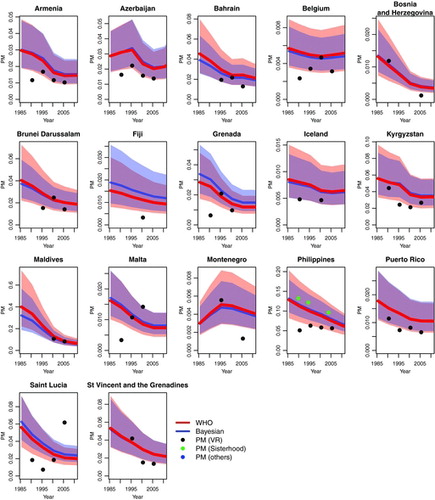
Figure 7. Maternal mortality (PM) estimates and 95% credible intervals for selected countries based on the modified WHO model (red) and the fully Bayesian model (blue). Observations are displayed by source type. The selected countries are the non-AIDS countries with VR data but without external information on the VR misclassification, for which the WHO used a multilevel model for constructing PM estimates.
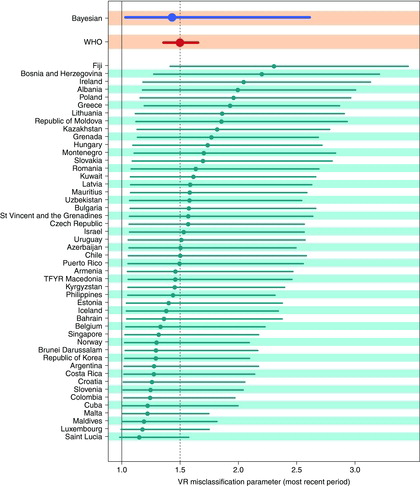
Figure 8. Bayesian posterior VR adjustment parameters in the most recent observation period for selected countries. The figure displays point estimates (dots) and 95% credible intervals (lines). The selected countries are all non-AIDS countries with VR data but without external information on the VR misclassification. The posterior Bayesian adjustment for a “new country” without information on pc and the WHO adjustment are added for comparison.
Naghavi, M., Makela, S., Foreman, K., O’Brien, J., Pourmalek, F., and Lozano, R. (2010), “Algorithms for Enhancing Public Health Utility of National Causes-of-Death Data,” Population Health Metrics, 8.