1,426
Views
10
CrossRef citations to date
0
Altmetric
Analyses of Florida Pediatric Cancer Data

Wombling Analysis of Childhood Tumor Rates in Florida

Pages 60-67 | Received 01 Jan 2014, Published online: 23 May 2014

Figures & data

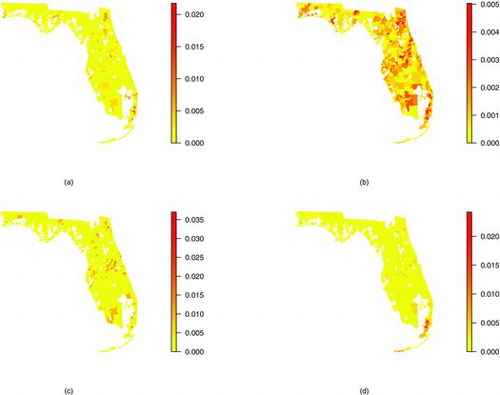
Figure 1. Percentage of total cancer cases within each ZCTA for (a) African American, (b) Caucasian, (c) other, and (d) unknown race.
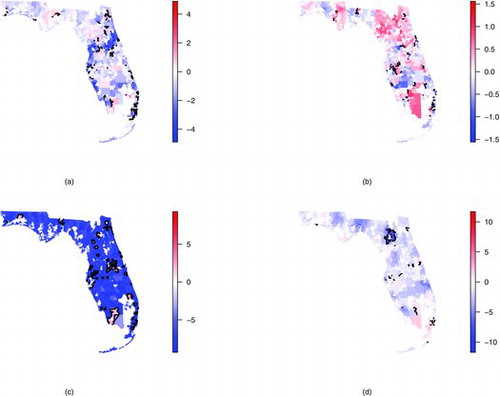
Figure 2. Spatial log relative risks ρzr for (a) African American, (b) Caucasian, (c) Other, and (d) unknown race. The black solid lines indicate a wombling boundary (i.e., regions of high rates of change).
Figure 2. Spatial log relative risks ρz∣r for (a) African American, (b) Caucasian, (c) Other, and (d) unknown race. The black solid lines indicate a wombling boundary (i.e., regions of high rates of change).

Table 1. ZCTA number for the 10 largest posterior means of ρzr by race

Table 2. Posterior summary of the coefficients β1 (median income; MI), β2 (percent in poverty; PP), and β3 (percent of homes built prior to 1990; <1990) for each race
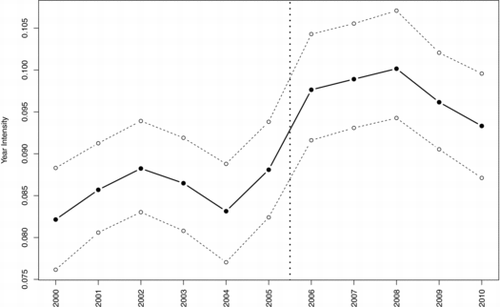
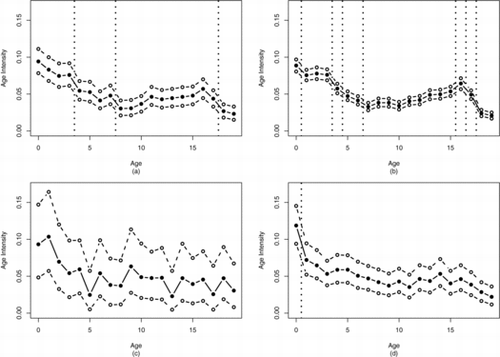
Figure 3. Posterior distribution of the temporal intensity of cancer cases () for y ∈ {2000, …, 2010}. The dashed lines are 95% credible interval limits. The vertical dotted line indicates a wombling boundary between 2005 and 2006.
Figure 4. Posterior distribution of the age intensity of cancer cases () for (a) African American (b) Caucasian, (c) “other,” and (d) unknown race. The dashed lines are 95% credible interval limits. The vertical dotted lines indicate wombling boundaries.

Table 3. Posterior mean of gender intensity ()