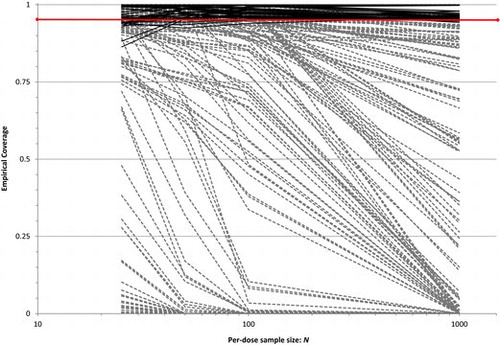
Figure 1. Wald-type 95% BMDL coverage for correctly specified (solid black lines) and misspecified (dashed gray lines) models at q = 0.10. (Data from West et al. Citation2012.) Thick horizontal bar is 95% nominal level.
Table 2. Multi-model benchmark analysis of CH2O carcinogenicity data in Section 4. Models, Mℓ, from Table 1. Benchmark response (BMR) set to q = 0.10
West, R.W., Piegorsch, W.W., Peña, E.A., An, L., Wu, W., Wickens, A.A., Xiong, H., and Chen, W. (2012), “The Impact of Model Uncertainty on Benchmark Dose Estimation,” Environmetrics, 23, 706–716.