Figure 1. Visualization of the (a) calculated log-transformed age-adjusted caner rates with upper 0.13% extreme observations, and (b) 983 ZCTAs in the map of Florida with a few highlighted areas that correspond to ZCTAs in the left panel.
Table 1. Posterior distributions and estimates of the number of clusters d for the 11 years
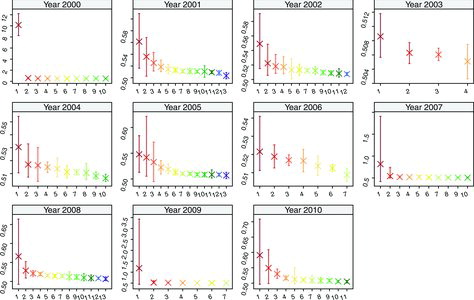
Figure 2. Posterior mean and 95% credible interval of the cluster mean age-adjusted rates (y-axis) versus cluster labels r = 1, 2, …, d (x-axis) for the 11 years.
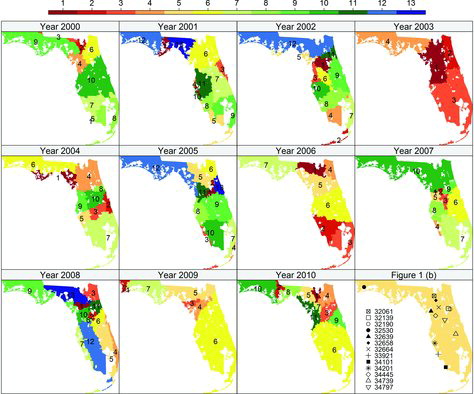
Figure 3. Map of the central clustering configuration with clustering labels assigned by descending order of the posterior mean of the cluster mean estimates for the 11 years.
Table 2. Posterior mean (2.5%, 97.5%th quantile) of the scaling parameter λk for k = 1 (intercept), k = 2 (percentage of male population), k = 3 (percentage of white population), and κ