3,897
Views
20
CrossRef citations to date
0
Altmetric
Value Added Metrics in Education

A Comparison of Student Growth Percentile and Value-Added Models of Teacher Performance

Pages 1-11 | Received 01 May 2014, Published online: 11 Jun 2015

Figures & data

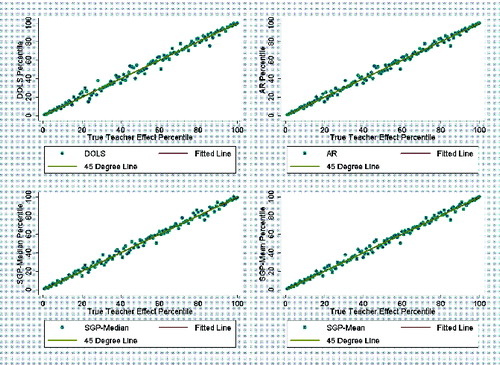
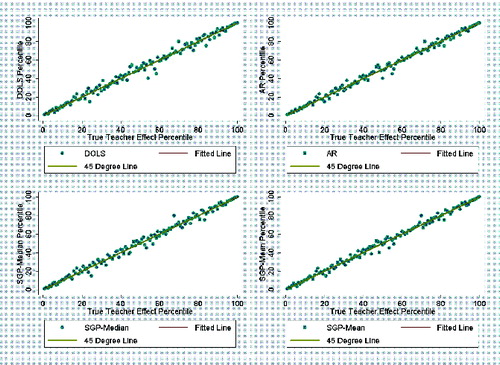
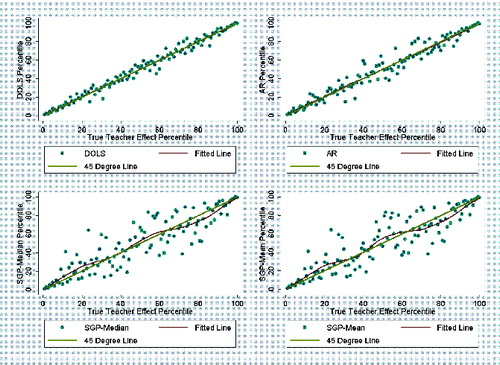
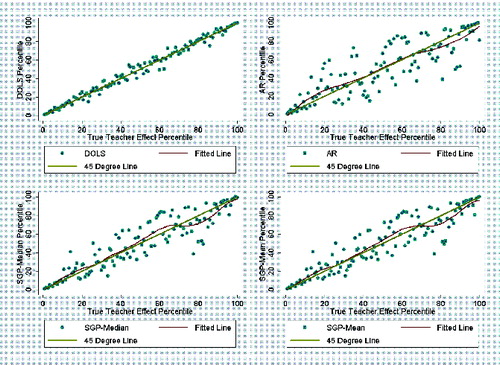
Table 1 Rank correlations and misclassification measures across estimators with simulated data generated with Normal(0,1) errors. Results from 100 replications. Row 1: average rank correlation. Row 2: percentage of teachers above bottom 25% in true effect misclassified in bottom 25%. Row 3: percentage of teachers in bottom 25% in true effect misclassified in top 75%

Figure 1 Plots of true teacher effect percentiles on DOLS, AR, SGP-Median, and SGP-Mean percentiles using simulated data—RG-RA scenario.
Figure 2 Plots of true teacher effect percentiles on DOLS, AR, SGP-Median, and SGP-Mean percentiles using simulated data—DG-RA scenario.
Figure 3 Plots of true teacher effect percentiles on DOLS, AR, SGP-Median, and SGP-Mean percentiles using simulated data—DG-PA scenario.
Figure 4 Plots of true teacher effect percentiles on DOLS, AR, SGP-Median, and SGP-Mean percentiles using simulated data—DG-NA scenario.

Table 2 Rank correlations and misclassification measures across estimators with simulated data generated with (3) errors. Results from 100 replications. Row 1: average rank correlation. Row 2: percentage of teachers above bottom 25% in true effect misclassified in bottom 25%. Row 3: percentage of teachers in bottom 25% in true effect misclassified in top 75%

Table 3 Spearman rank correlations across estimators for nonrandom grouping and random grouping schools in administrative dataset. Grades 5 and 6. Years 2002–2007

Table 4 Fraction of teachers rated in bottom 25% in the initial estimator who are not rated in bottom 25% in another estimator for nonrandom grouping and random grouping schools

Table 5 Fraction of teachers rated in top 25% in the initial estimator who are not rated in top 25% in another estimator for nonrandom grouping and random grouping schools

Appendix A Summary statistics for administrative data