
Figures & data
Fig. 1 Map of the ZCTAs that belong to the TJHD (boundary indicated as the wider dark blue line). Areas which lie outside the TJHD boundary are colored gray.
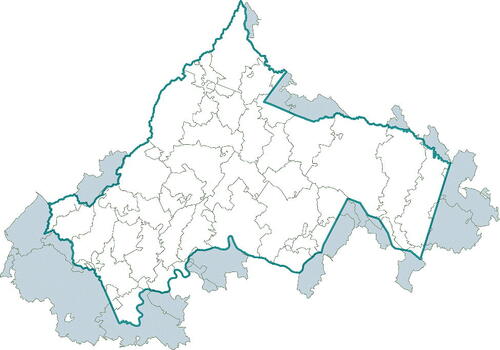
Table 1 The 14 features along with their transformations. All features except for Population_Density, Median_HH_Inc, and Mean_HH_Inc reflect the percent of population.
Fig. 2 Map showing the 9 ZCTAs that were excluded from the stratification analysis. ZCTAs 24581 and 22904 (colored solid red) were excluded due to their unusual populations for our purposes (only 33 people and transient student population, respectively). ZCTAs 22952, 24483, 23015, 24521, 23192, 23102, and 23038 (shaded with diagonal lines) were excluded following the allocation factor analysis which identified them as ZCTAs with allocations factors .
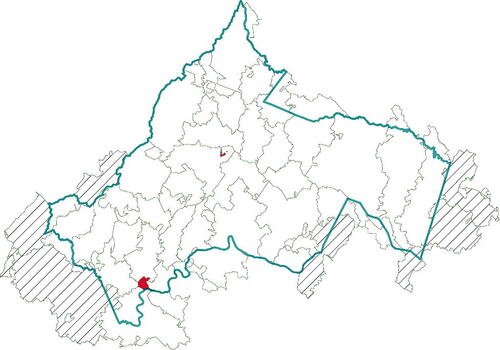
Fig. 3 Dendrogram of the 8 strata found using hierarchical clustering. The dendrogram branch colors indicate ZCTA stratum membership and match the colors used in the top map in . The color bar to the immediate right of the dendrogram is another representation of ZCTA stratum membership for the 8 strata determined via hierarchical clustering and is provided to facilitate the understanding of the manual split which lead to 12 strata (shown as the color bar on the right hand side of the figure indicating ZCTA stratum membership for the 12 strata after both stratum 4 and stratum 6 were manually split into 3 strata each: 4a, 4b, 4c; 6a, 6b, 6c). The colors in the rightmost color bar match the colors used in the bottom map in which shows the 12 strata following the manual split.
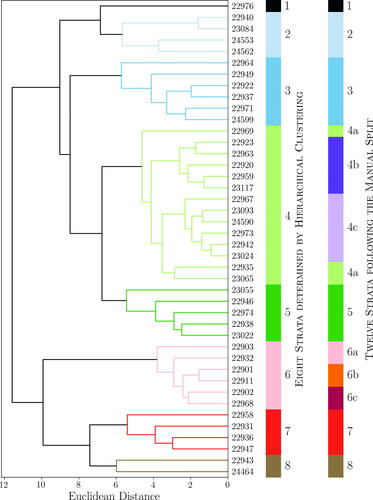
Fig. 4 Top: Map of the 8 strata determined by hierarchical clustering. The colors indicate ZCTA stratum membership and match the branch colors of the dendrogram and color bar to the immediate right of the dendrogram in . Bottom: Map of the 12 strata which result after manually splitting 2 of the 8 strata identified by hierarchical clustering. The colors indicate ZCTA stratum membership and match the rightmost color bar in .
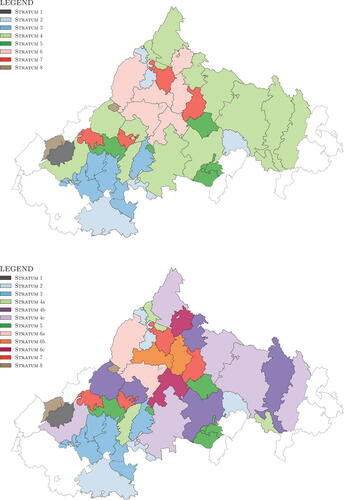
Table 2 Stratum statistics for the 8 strata identified by hierarchical clustering. Household count and population estimates come from the 2016 ACS 5-year estimates.
Table 3 Stratum statistics for the 12 strata that result after manually splitting the eight strata identified by hierarchical clustering. Household count and population estimates come from the 2016 ACS 5-year estimates.
Table 4 Survey design and sampling rate where the strata are ordered by Household Count. Note that the number of addresses to sample in each stratum is determined by power allocation (see EquationEquation (1)(1)
(1) ), except for stratum 1 and stratum 8, which are fixed at 100 each. Household counts come from the 2016 ACS 5-year estimates.
Table 5 The Centers for Disease Control and Prevention BMI classification for adults and children.
Fig. 5 Maps showing prevalence of obesity by ZCTA for adults (top) and children (bottom).
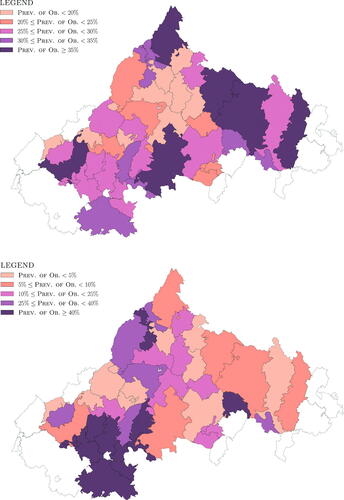
Table 6 Point estimates and margin of error (MOE, the half-width of the 95% confidence interval) for the prevalence of obesity and the number of individuals in the population classified as obese by ZCTA stratum for both adults and children. The final row presents the prevalence of obesity and the number of individuals in the population classified as obese across the entire district (all ZCTAs).