
Figures & data
Fig. 1 The G.I. Joe chart.
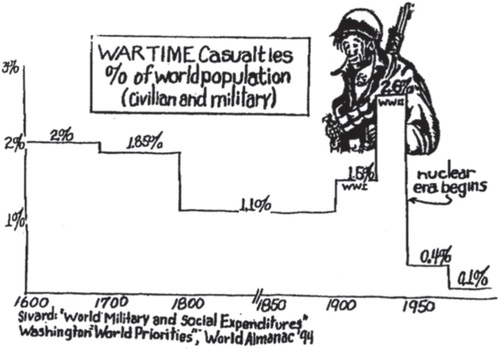
Fig. 2 U.S. Nuclear Policy in the 21st Century (1998) wartime fatalities chart.
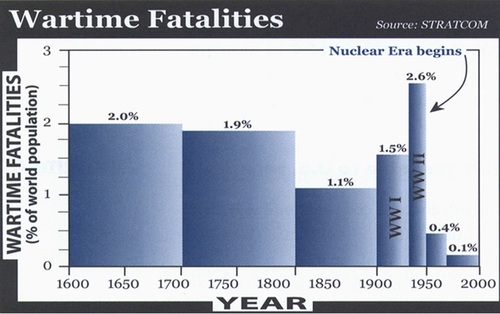
Fig. 3 2018 Nuclear Posture Review figure.
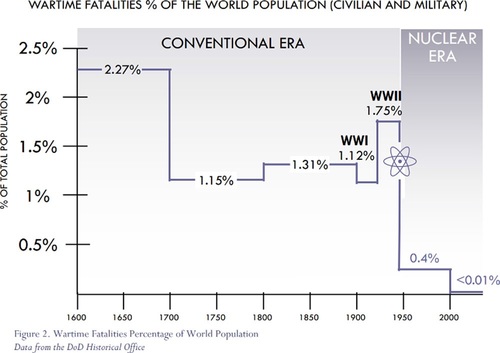
Fig. 4 Reproduction of the G.I. Joe chart using the cited data.
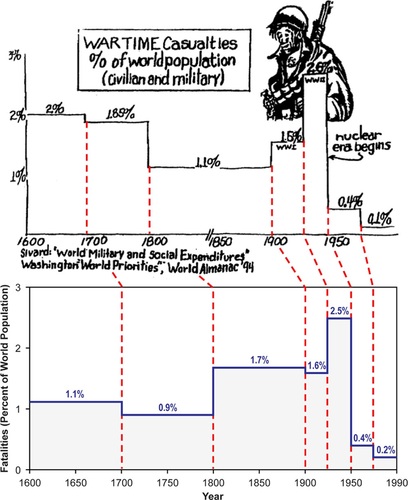
Fig. 5 Attempted reproduction of the NPR figure.
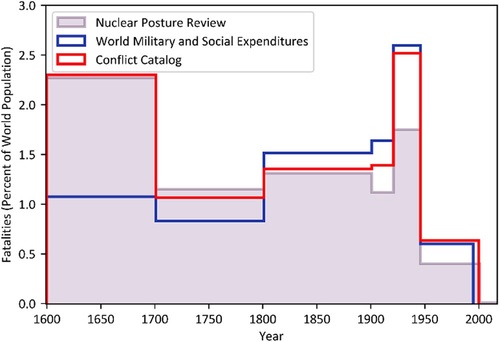
Fig. 6 Comparison of the wartime fatality databases.
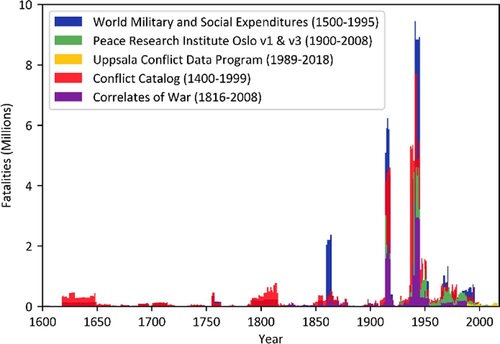
Fig. 7 Comparison of the world population estimates from 1600 to 2016.
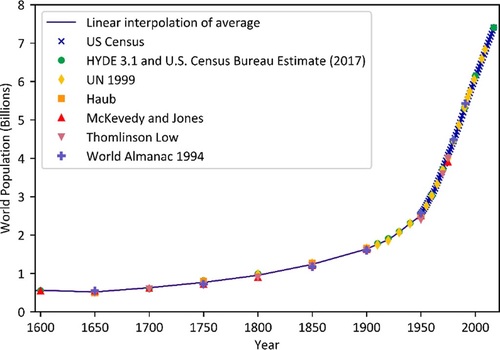
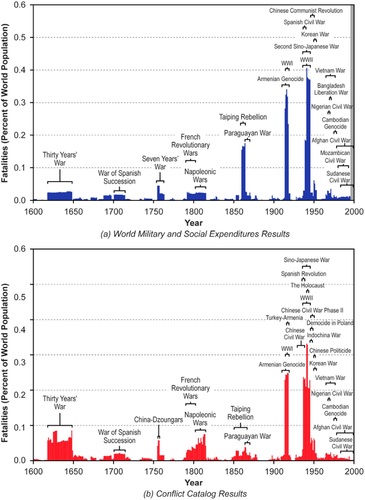
Fig. 8 Wartime fatalities as a percentage of world population.
Supplemental material