
Figures & data
Table 1 Summary of population and crime counts and rates per 100,000 People in 2018–2019.
Fig. 1 Variation in the openness index during the lockdowns. Week 10 begins on March 8, 2020, and Week 21 begins on May 24, 2020.
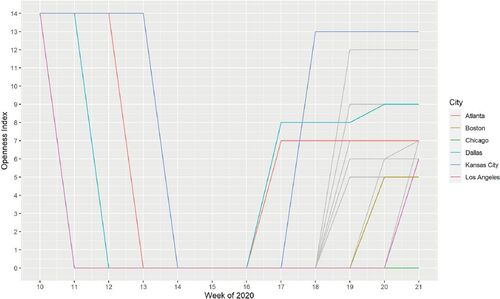
Fig. 2 Changes in robbery rates during the lockdown relative to typical seasonal levels due to openness index. Week 10 begins on March 8, 2020, and Week 21 begins on May 24, 2020. The value in parentheses is the average value of the openness index in that week.
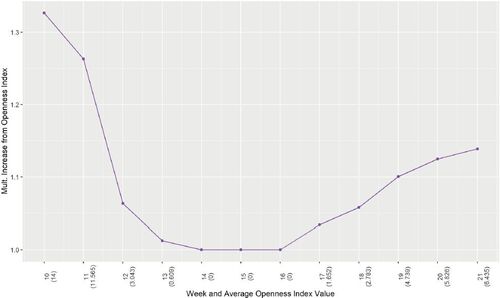
Fig. 3 Biweekly 2020 differences in robbery rates during the lockdown relative to typical seasonal levels with 95% confidence intervals.
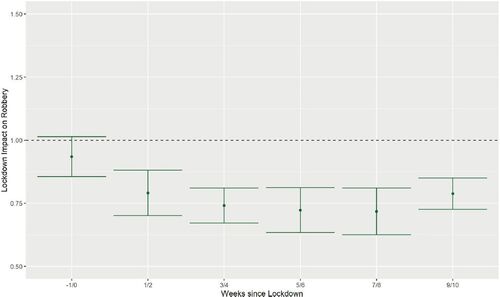
Fig. 4 Biweekly 2020 differences in larceny rates during the lockdown relative to typical seasonal levels with 95% confidence intervals.
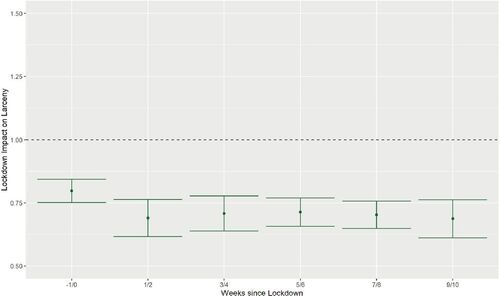
Fig. 5 Biweekly 2020 differences in homicide rates during the lockdown relative to typical seasonal levels with 95% confidence intervals.
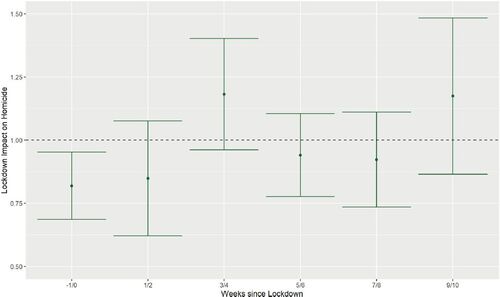
Fig. 6 Biweekly 2020 differences in auto theft rates during the lockdown relative to typical seasonal levels with 95% confidence intervals.
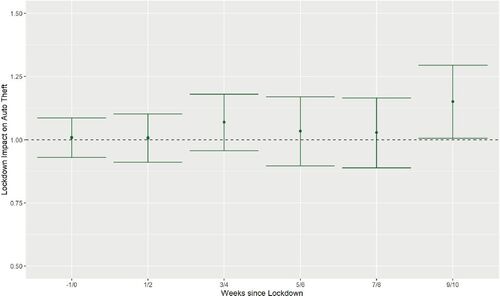
Fig. 7 Biweekly 2020 differences in burglary rates during the lockdown relative to typical seasonal levels with 95% confidence intervals.
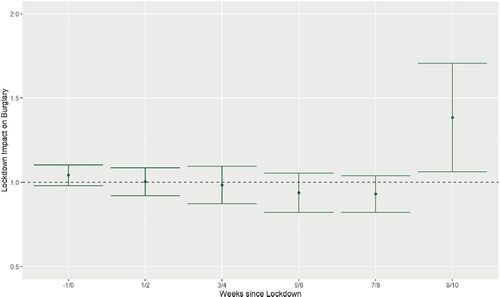
Fig. 8 Changes in homicide rates in 2020 compared to typical seasonal trends with 95% confidence intervals.
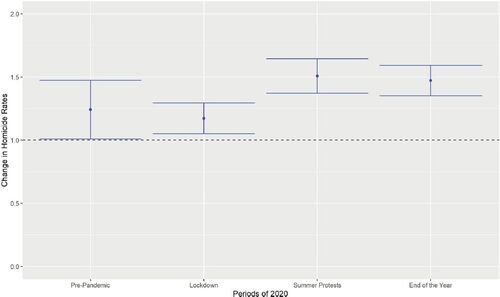
Fig. 9 Changes in auto theft rates in 2020 compared to typical seasonal trends with 95% confidence intervals.
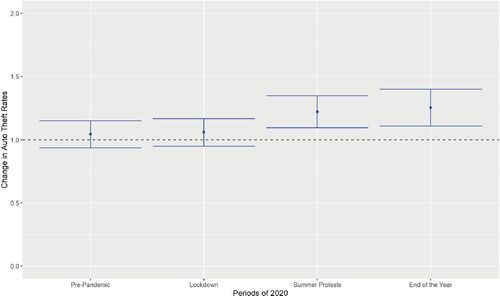
Fig. 10 Changes in burglary rates in 2020 compared to typical seasonal trends with 95% confidence intervals.
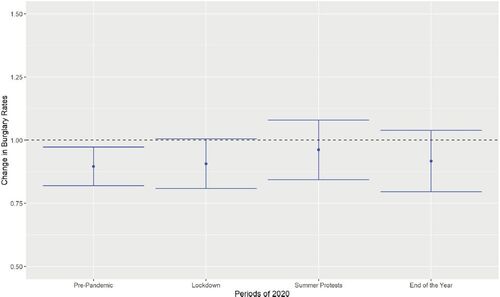
Fig. 11 Changes in robbery rates in 2020 compared to typical seasonal trends with 95% confidence intervals.
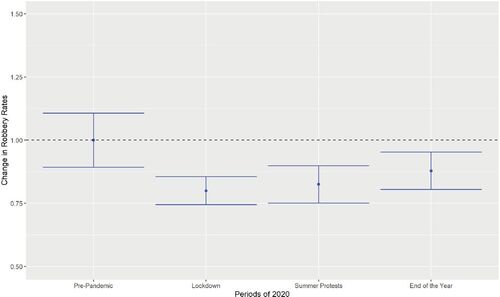
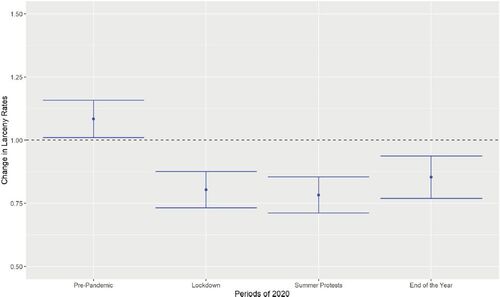
Fig. 12 Changes in larceny rates in 2020 compared to typical seasonal trends with 95% confidence intervals.
Supplemental Material
Download MS Excel (67.3 KB)Supplemental Material
Download MS Excel (30.4 KB)Supplemental Material
Download PDF (8.9 KB)Data Availability Statement
The datasets generated during and/or analyzed during the current study are available in the covid-crime repository, https://github.com/mmeyer717/covid-crime.