Figures & data
Fig. 1 Purely spatial clusters calculated with county-level jail incarceration counts and the population of each county using the discrete scan statistic with Poisson distribution. The clusters are overlaid onto a choropleth map of the relative risk of jail incarceration in each county. The 20 clusters with the highest likelihood-ratios are labeled.
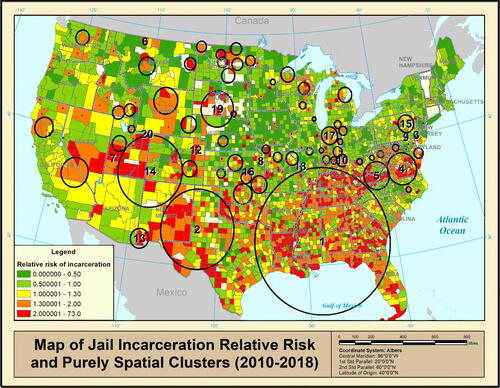
Table 1 The top 20 significant purely spatial clusters of jail incarceration for 2010–2018 based on the likelihood-ratio of the purely spatial scan statistic (
Fig. 2 Retrospective space-time clusters calculated using the discrete scan statistic with poisson distribution. The 20 clusters with the highest likelihood-ratios are labeled.
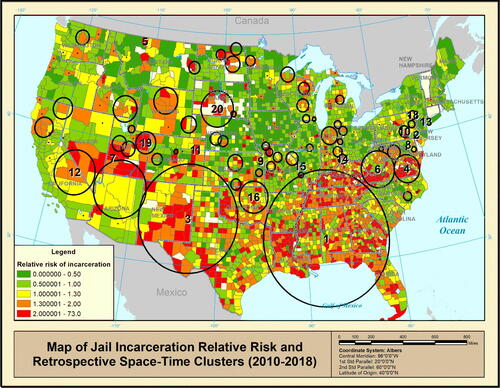
Table 2 The top 20 significant retrospective space-time clusters of jail incarceration for 2010–2018 based on the likelihood-ratio of the retrospective space-time scan statistic (
Fig. 3 Prospective space-time clusters calculated using the discrete scan statistic with poisson distribution. The 20 clusters with the highest likelihood-ratios are labeled.
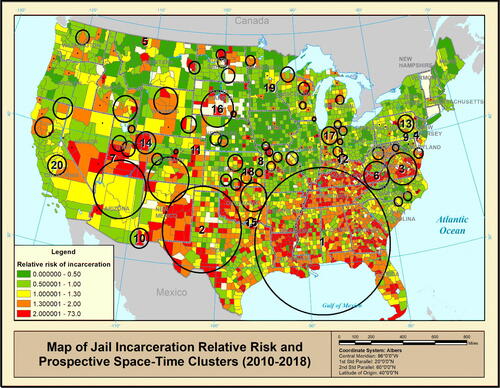
Table 3 The top 20 significant prospective space-time clusters of jail incarceration for 2010–2018 based on the likelihood-ratio of the prospective space-time scan statistic (
Table 4 Parameter estimates from the negative binomial regression model.
Fig. 4 A Comparison map of locations in the original unadjusted spatial clusters and locations in covariate-adjusted spatial clusters. Red areas represent those which appeared only in the original significant spatial clusters. Yellow areas are clusters which appeared only after adjusting for the covariates. Orange areas or those which appeared in clusters both before and after covariate adjustment.

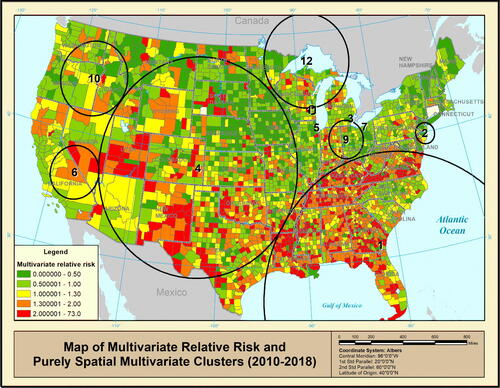
Table 5 Multivariate clusters of jail incarceration, republican vote, poverty, and black population %. (p < 0.0001).
Fig. 5 Purely spatial multivariate clusters of jail population, poverty, republican vote, and Black population.