Figures & data
Table 1 Design matrix with two judges/individuals, three objects, and one continuous subject-specific covariate.
Table 2 Descriptive statistics for the subject-specific covariates selected by the BTLL model.
Fig. 1 Pruned regression trunk.
NOTE: In each terminal node and in the root note, the number of countries H, the consensus ordering C, and the correlation coefficient τx are shown. Taxes are named as follows: I - Taxes on income, S - Social security contributions, P - Taxes on property, and G - Taxes on goods. When two tax categories are in brackets, it means they are in a tie.
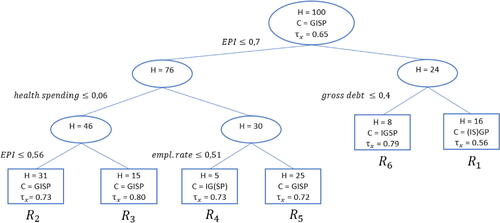
Table 3 Pruned BTRT regression trunk.
Table 4 Pruned BTRT regression trunk: 10-fold cross-validation results.
Fig. 2 Countries’ distribution map in each region (terminal node) , where R1 is the reference region in the BTRT model.
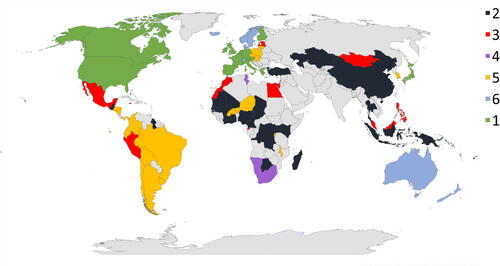
Table 5 BTRT estimated coefficients.
Table 6 Mean worth parameters πi for each tax revenue category in each terminal node of the pruned regression trunk.
Table 7 OLS estimated coefficients with interaction effects.
Fig. 3 Mean worth parameters πi conditioned to the share of agricultural sector to GDP.
NOTE: The worth parameters are computed for by fixing all covariates (except for the share of the agricultural sector) to the average level of the group. The order of graphs within the figure follows the trunk in : R2 top left, R3 top right, R4 center left, R5 center right, R6 bottom left, R1 bottom right. The x-axis shows simulated values of the covariate agricultural share within the standardized range
. Finally, for each plot, the mean values of the covariates resulting from the splitting procedure of the regression trunk are reported. For the sake of clarity, the mean values of all the other country-specific covariates are not reported.
![Fig. 3 Mean worth parameters πi conditioned to the share of agricultural sector to GDP.NOTE: The worth parameters are computed for R1,…,R6 by fixing all covariates (except for the share of the agricultural sector) to the average level of the group. The order of graphs within the figure follows the trunk in Figure 1: R2 top left, R3 top right, R4 center left, R5 center right, R6 bottom left, R1 bottom right. The x-axis shows simulated values of the covariate agricultural share within the standardized range [0,1]. Finally, for each plot, the mean values of the covariates resulting from the splitting procedure of the regression trunk are reported. For the sake of clarity, the mean values of all the other country-specific covariates are not reported.](/cms/asset/f566c437-54c0-41b5-9a21-45e7cc109d9d/uspp_a_2356507_f0003_c.jpg)
Table 8 Log-linear Bradley-Terry model without subject-specific covariates: results.
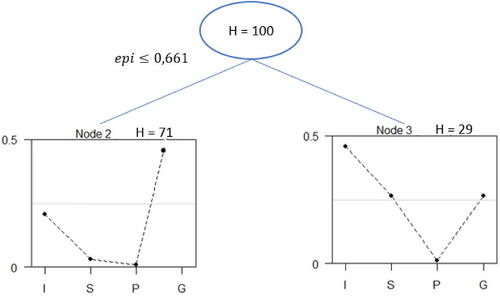
Fig. 4 Output of BTtree.
NOTE: H is the number of countries, I = taxes on income, S = social security contributions, P = taxes on property, and G = taxes on goods and services. The plot shows the estimated worth parameters in both terminal nodes.