Figures & data
Table 1. Per capita waste generation rate
Table 2. Statistics of MSW generated in different states in India
Figure 1. (a) Per capita generation of MSW selected Indian cities in 2000 and 2011, (b) Per capita generation of MSW in selected Indian states in 2000 and 2011.
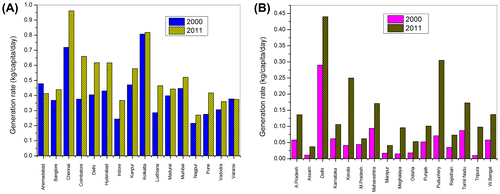
Figure 2. Collection efficiency of selected Indian states (CPCB, Citation2013).
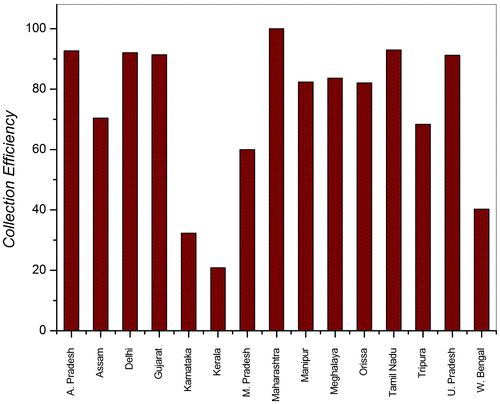
Table 3. Change in composition of municipal solid waste with time (in %)
Figure 3. Prediction Plot for MSW generation, land requirement, and population from 2001 to 2051.
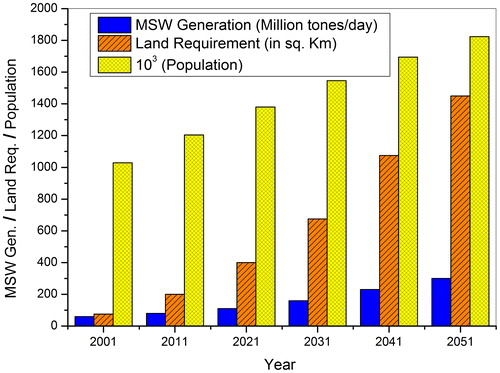
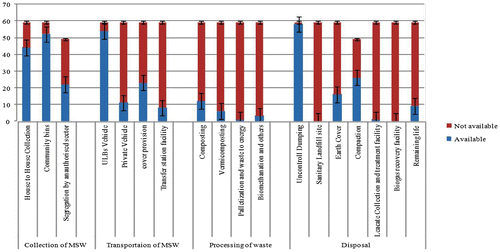
Figure 4. MSWM practices in selected Indian cities (Kumar et al., Citation2009).