1,294
Views
5
CrossRef citations to date
0
Altmetric
Research Article

Elephant (Loxodonta africana) GPS collar data show multiple peaks of occurrence farther from water sources

ORCID Icon, , & | (Reviewing Editor)
Article: 1420364 | Received 26 May 2017, Accepted 22 Nov 2017, Published online: 08 Jan 2018

Figures & data

Figure 1. Hypothetical framework: the predicted response of elephants to water in (a) an imaginary homogeneous landscape characterised by uniform forage quantity and (b) a more realistic heterogeneous landscape characterised by non-uniform forage quantity.
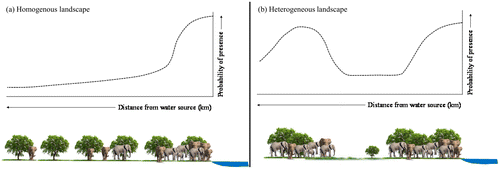
Figure 1. Hypothetical framework: the predicted response of elephants to water in (a) an imaginary homogeneous landscape characterised by uniform forage quantity and (b) a more realistic heterogeneous landscape characterised by non-uniform forage quantity.

Figure 2. Elephant location data (from Global Positioning System (GPS) collars) collected from the eight elephants during 13 selected months between July 2009 and November 2011 in northern Gonarezhou National Park, south-east Zimbabwe.
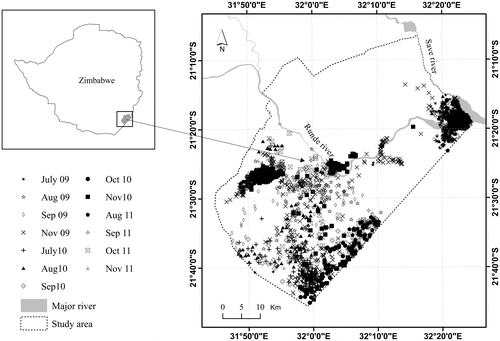
Figure 2. Elephant location data (from Global Positioning System (GPS) collars) collected from the eight elephants during 13 selected months between July 2009 and November 2011 in northern Gonarezhou National Park, south-east Zimbabwe.

Table 1. Elephant occurrence points used in the prediction of elephant habitat and the dates on which terra/MODIS NDVI image was acquired

Table 2. Performance and variable contribution of the MaxEnt models predicting the geographical distribution of elephants in the GNP during the dry season months of 2009, 2010 and 2011

Figure 3. Probability of elephant occurrence (P(E)) plotted against distance from water sources and NDVI from July 2009 to November 2011. Elephant occurrence generally peaked at least twice with distance from water sources.
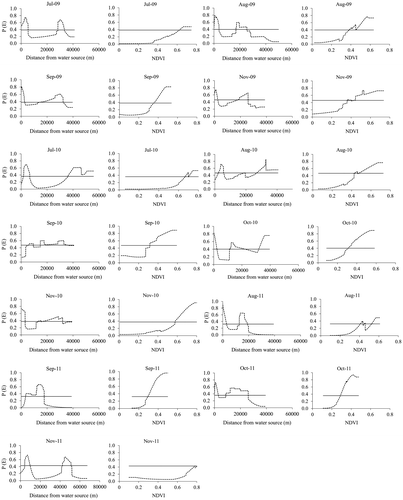
Notes: The continuous horizontal line represents the logistic threshold value of equal training sensitivity and specificity (values above the line represent elephant habitat while those below represent non-habitat).
Figure 3. Probability of elephant occurrence (P(E)) plotted against distance from water sources and NDVI from July 2009 to November 2011. Elephant occurrence generally peaked at least twice with distance from water sources.

Table 3. Peaks of elephant occurrence away from water sources and minimum NDVI within elephant habitat (habitat = probability values > the logistic threshold of equal training sensitivity and specificity)

Figure 4. Probability of elephant occurrence (P(E))—dotted line, and NDVI—continuous line plotted against distance from water sources, from July 2009 to November 2011.
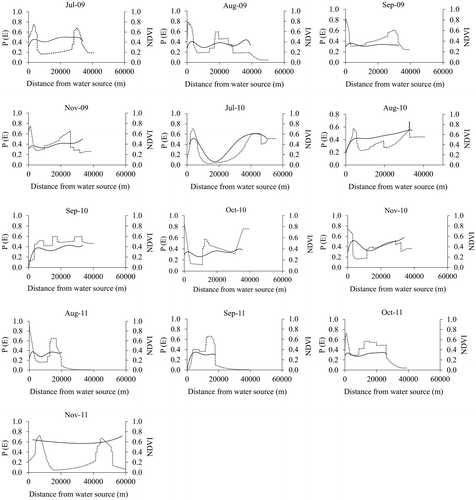
Figure 4. Probability of elephant occurrence (P(E))—dotted line, and NDVI—continuous line plotted against distance from water sources, from July 2009 to November 2011.
Supplemental material