
Figures & data
Figure 1. Map of the study area.
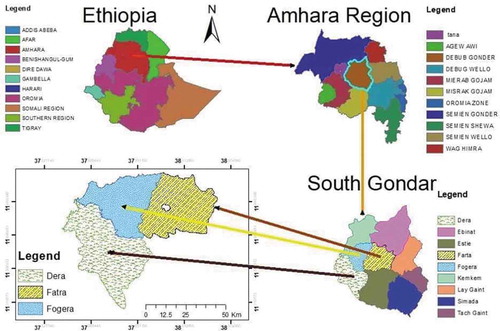
Table 1. Definition and descriptive statistics of socioeconomic and demographic variables
Figure 2. Willingness to pay curve in terms of cash payment for church forest conservation in the study area.
Figure 3. Willingness to pay curve in terms of labor contribution for church forest conservation in the study area.
Table 2. Joint responses to stated bids
Table 3. Result of the Tobit model