
Figures & data
Table 1. Summary of explanatory variables for MVP model regression
Table 2. Farmers’ perception on main climate change elements, n = 260
Table 3. Pooled adaptation choices of farmers to climate change, n = 260
Figure 1. Map of the study district.
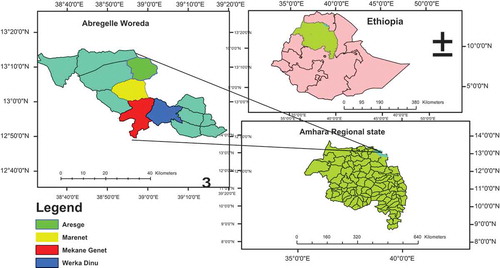
Figure 2. Barriers to climate change adaptation.
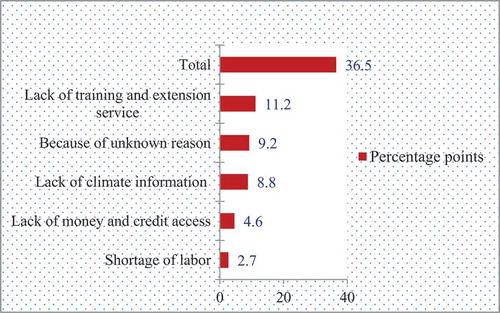
Table 4. Parameter estimation of the multivariate probit model
Table 5. The marginal effect of determinants on household’s adaptation choices
Table 6. The marginal success probabilities of each adaptation choices
Table 7. The joint probabilities of success or failure of adaptation of the four choices
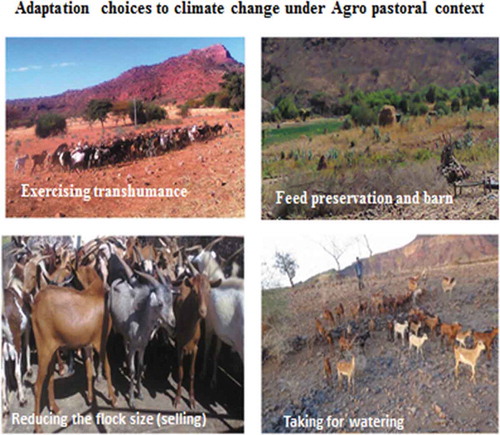
Table A1. Multicollinearity test of continuous explanatory variables
Table A2. Multicollinearity test of dummy explanatory variables
Table A3. Heteroskedasticity test of the dependent variables Ho: Constant variance
Table A4. Conversion factor of adult equivalent (labor force)
Table A5. Conversion equivalents of the Sub-Saharan Africa livestock into TLU
Figure A1. Annual temperature trends of Abergelie district (2006–2016).
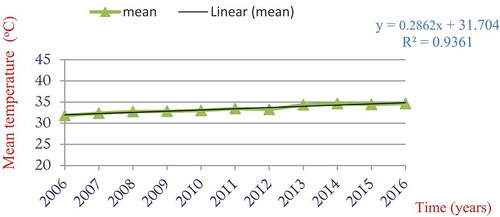
Figure A2. Annual rainfall trends of Abergelie district (2006–2016).
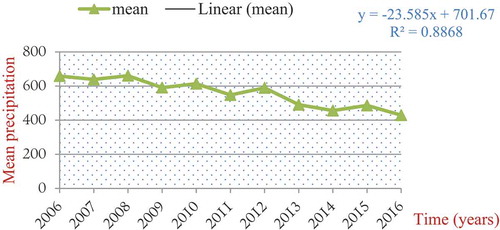
Table A6. The mean comparison of households’ multiple adaptation choices (MANOVA)