1,418
Views
1
CrossRef citations to date
0
Altmetric
ENVIRONMENTAL HEALTH

Effect of spirotetramat and 2,4-dichlorophenoxyacetic pesticides on two phytoplankton species (Monoraphidium griffithii and Coscinodiscus sp.) in a single and compound mixture laboratory exposure

ORCID Icon, , , & | (Reviewing editor)
Article: 1724064 | Received 09 Jan 2018, Accepted 13 Jan 2020, Published online: 05 Feb 2020

Figures & data

Table 1. Chemical composition of the culture solution (bold medium) modified from Barberousse (Citation2006)

Table 2. Highest cell density and chlorophyll-a concentrations in Monoraphidium griffithii and Coscinodiscus sp. cultures for the various treatments

Figure 1. Cell density and Chlorophyll-a concentration in Monoraphidium griffithii cultivated under six different conditions (five polluted environments and one control). Lines and symbols indicate cell density, bars indicate chlorophyll-a concentration. Error bars indicate average ± standard deviation
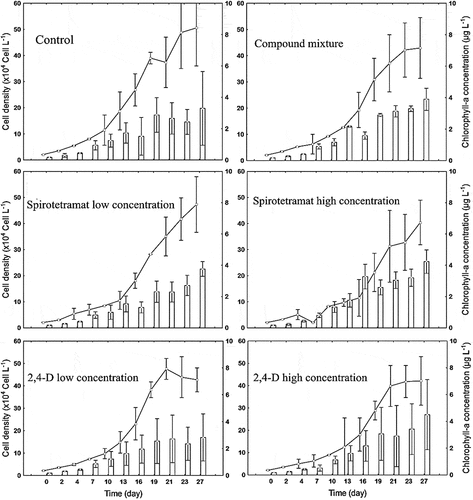
Figure 1. Cell density and Chlorophyll-a concentration in Monoraphidium griffithii cultivated under six different conditions (five polluted environments and one control). Lines and symbols indicate cell density, bars indicate chlorophyll-a concentration. Error bars indicate average ± standard deviation

Figure 2. Cell density and Chlorophyll-a concentration in Coscinodiscus sp. cultivated under six different conditions (five polluted environments and one control). Lines and symbols indicate cell density; bars indicate chlorophyll-a concentration. Error bars indicate average ± standard deviation
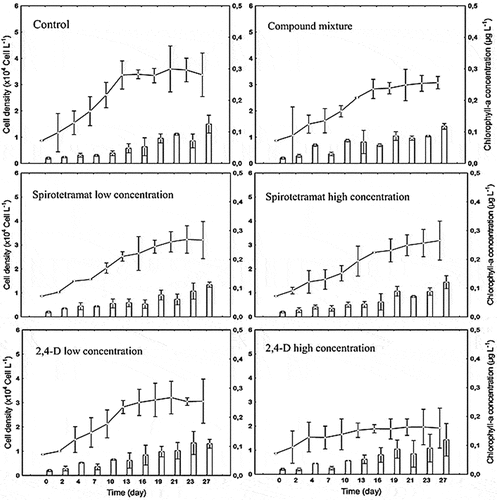
Figure 2. Cell density and Chlorophyll-a concentration in Coscinodiscus sp. cultivated under six different conditions (five polluted environments and one control). Lines and symbols indicate cell density; bars indicate chlorophyll-a concentration. Error bars indicate average ± standard deviation

Figure 3. Phytoplankton cell size classes (CI-CIII, C1-C3) obtained from cluster analysis for the different treatments. (A): sizes identified for M. griffithiitreatments; (B): sizes identified for Coscinodiscus sp. treatments. l is length, d is diameter
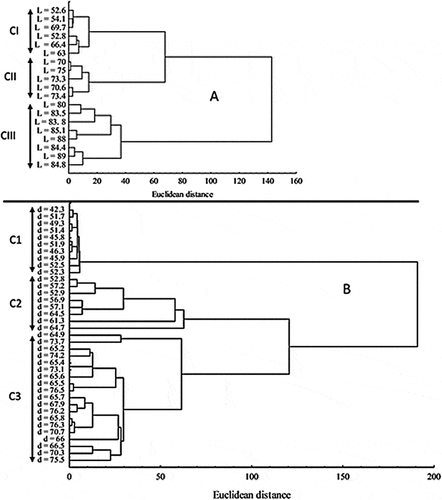
Figure 3. Phytoplankton cell size classes (CI-CIII, C1-C3) obtained from cluster analysis for the different treatments. (A): sizes identified for M. griffithiitreatments; (B): sizes identified for Coscinodiscus sp. treatments. l is length, d is diameter

Figure 4. Occurrence of cell size classes in Monoraphidium griffithii for the various treatments. CI includes cells of 52.6–70 µm in length (small cell size), CII cells of 70–80 µm in length (moderate cell size), and CIII cells of 80–89 µm in length (large cell size). D1 and D2 indicate low and high concentrations, respectively. Cont = control, Spiro = spirotetramat. Error bars indicate average ± standard deviation
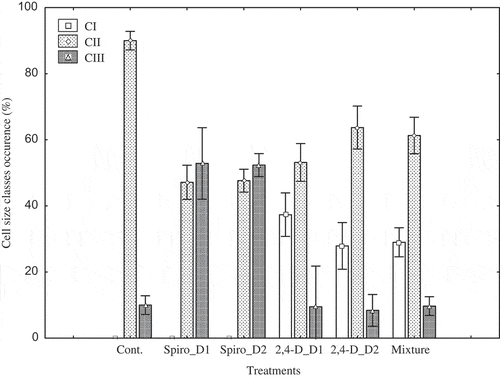
Figure 4. Occurrence of cell size classes in Monoraphidium griffithii for the various treatments. CI includes cells of 52.6–70 µm in length (small cell size), CII cells of 70–80 µm in length (moderate cell size), and CIII cells of 80–89 µm in length (large cell size). D1 and D2 indicate low and high concentrations, respectively. Cont = control, Spiro = spirotetramat. Error bars indicate average ± standard deviation

Figure 5. Occurrence of cell size classes in Coscinodiscussp. for the various treatments. C1 includes cells of 42.3–52.5 µm in diameter (small cell size), C2 cells of 52.3–64.7 µm in diameter (moderate cell size), and C3 cells of 64.7–76.5 µm in diameter (large cell size). D1 and D2 indicate low and high concentrations, respectively, Cont = control, Spiro = spirotetramat. Error bars indicate average ± standard deviation
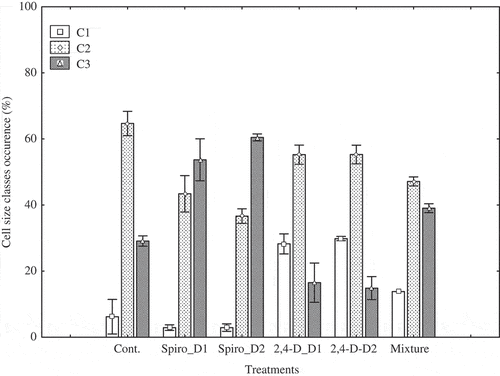
Figure 5. Occurrence of cell size classes in Coscinodiscussp. for the various treatments. C1 includes cells of 42.3–52.5 µm in diameter (small cell size), C2 cells of 52.3–64.7 µm in diameter (moderate cell size), and C3 cells of 64.7–76.5 µm in diameter (large cell size). D1 and D2 indicate low and high concentrations, respectively, Cont = control, Spiro = spirotetramat. Error bars indicate average ± standard deviation