
Figures & data
Table 1. Physical properties of the tailings
Table 2. Results of the atomic absorption analysis of the tailings
Figure 1. Porosity values for Mont Wright Pozzolanic tailings matrices
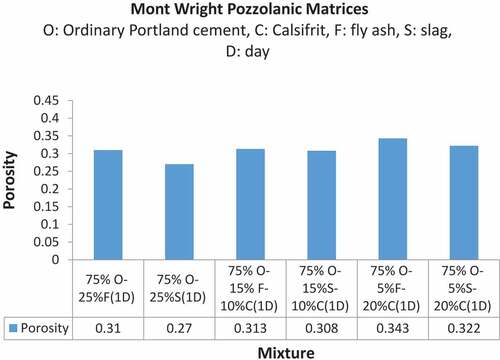
Figure 2. Porosity values for Mont Wright tailings matrices
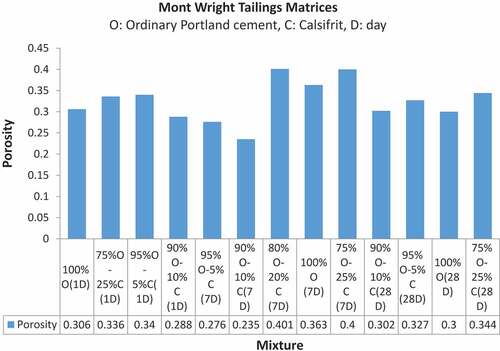
Figure 3. Porosity values for Musselwhite tailings matrices
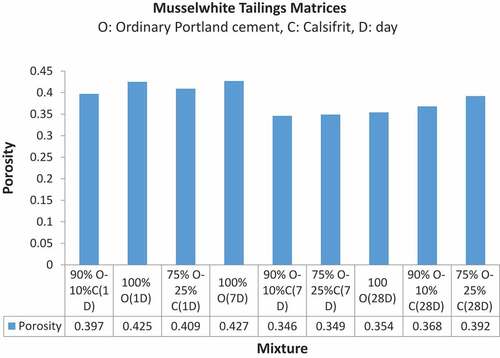
Figure 4. Porosity values for Musselwhite Pozzolanic tailings matrices
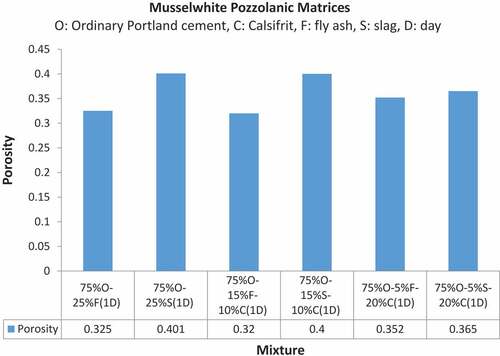
Figure 5. Microscopic images of (a) Mont Wright (75% OPC, 15% S, 10% CF (1day)), and (b) Musselwhite tailings matrices (75% OPC, 15% S, 10% CF (1 day))
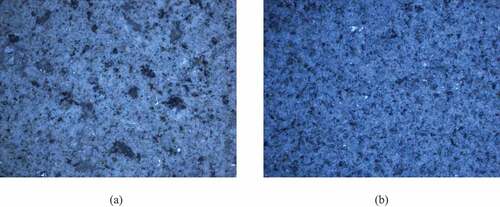
Figure 6. The strength test results of Mont Wright Tailings Matrices and the predicted strength using the models of Chen et al. (Citation2013), Ryshkevitch (Citation1953), Schiller (Citation1971), Balshin (Citation1949), and CitationHasselman(Citation1969)
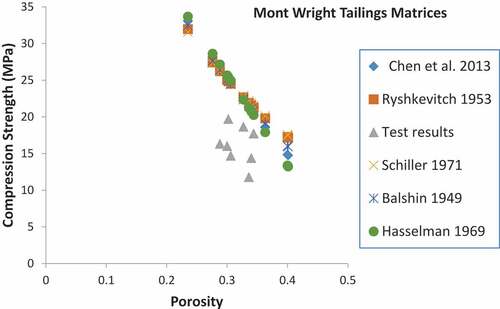
Figure 7. The strength test results of Mont Wright Pozzolanic Matrices and the predicted strength using the models of Chen et al. (Citation2013), Ryshkevitch (Citation1953), Schiller (Citation1971), Balshin (Citation1949), and CitationHasselman(Citation1969)
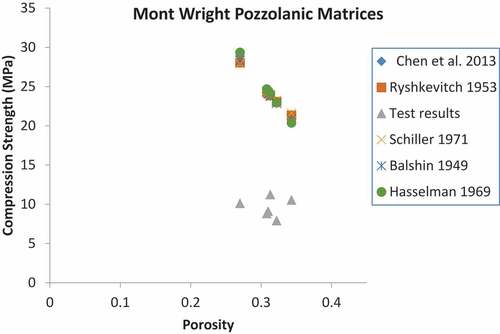
Figure 8. The strength test results of Musselwhite Tailings Matrices and the predicted strength using the models Chen et al. (Citation2013), Ryshkevitch (Citation1953), Schiller (Citation1971), Balshin (Citation1949), and CitationHasselman(Citation1969)
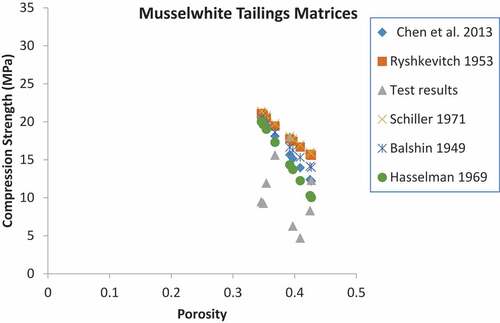
Figure 9. The strength test results of Musselwhite Pozzolanic Matrices and the predicted strength using the models of Chen et al. (Citation2013), Ryshkevitch (Citation1953), Schiller (Citation1971), Balshin (Citation1949), and CitationHasselman(Citation1969)
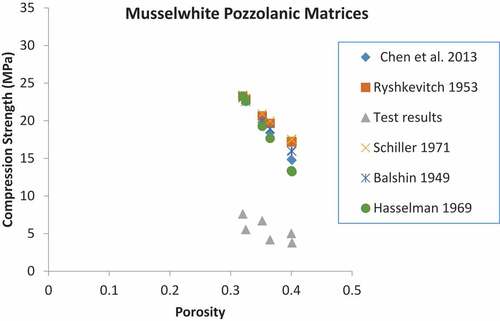
Table 3. TCLP test results for Mont Wright and Musselwhite matrices