Figures & data
Table 1. Physical and chemical characterization of the soil at the experimental site
Figure 1. The interior of the experimental station with its 24 concrete compartments
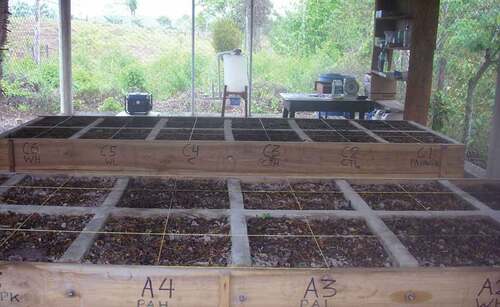
Table 2. Treatment levels of the three amendments
Figure 2. Effect of the different amendments on the degradation of the total diesel range hydrocarbons. The X-axis indicate the percentage of the diesel that remained in the soil. The white rhombi indicates statistical significance (based on the data before normalisation) and the errors bars indicate standard deviation of the normalized data. The abbreviations reflect the type of amendments and treatment level (high/low) according to the following; C = Control, CTH = Compost tea high, CTL = Compost tea low, PAH Pyroligneous acid high, PAL = Pyroligneous acid low, WH = Whey high, WL = Whey low