
Figures & data
Figure 1. Location and elevation map of the study area.
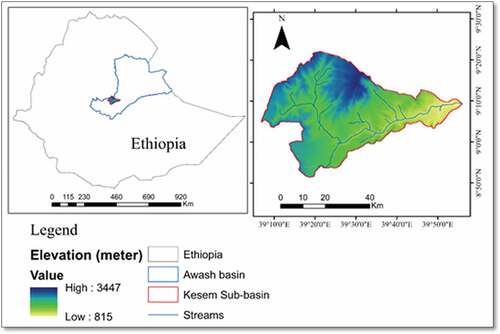
Figure 2. Flow chart showing the general methodology of land use/cover evaluation (Source: Bekele et al., Citation2018).
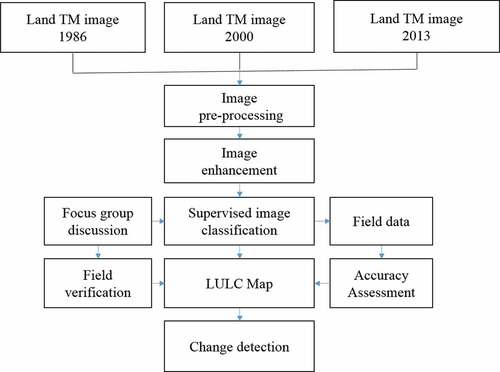
Table 1. Confusion matrix of land use/cover classification
Table 2. Description of each land use/cover type in the study area
Figure 3. LULC map of the Kesem sub-basin in 1986.
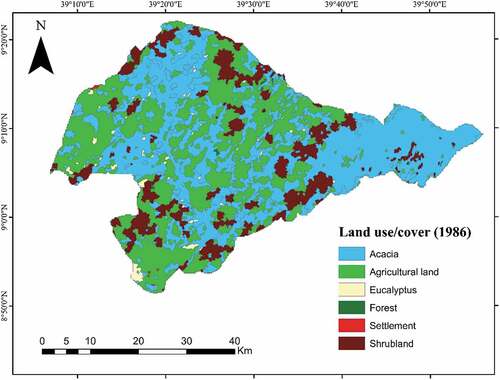
Table 3. Land use/cover change in Kesem sub-basin from 1986 to 2013
Figure 4. LULC map of the Kesem sub-basin in 2000.
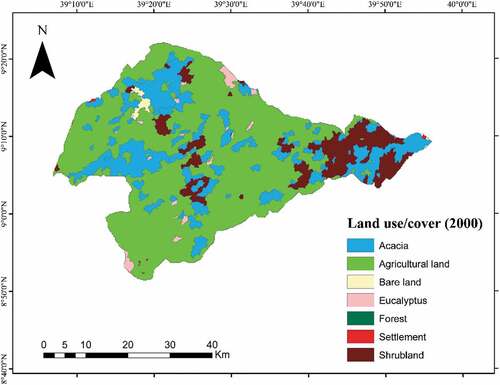
Figure 5. LULC map of the sub-basin in 2013.
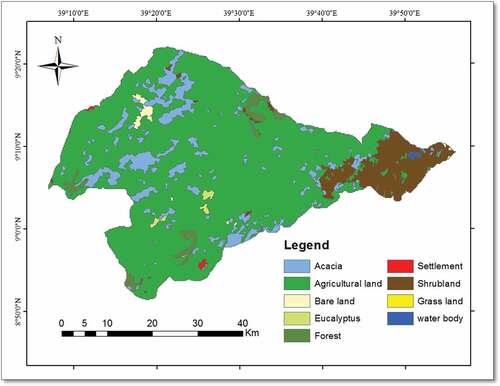
Table 4. Land use/cover transition matrix area in km2 and percent from 1986 to 2013
Table 5. Land use/cover change drivers and effects as perceived by the local people