Figures & data
Figure 1. Map of sampled sites in Eleyele Lake, Ibadan City, Oyo State, south-western, Nigeria.
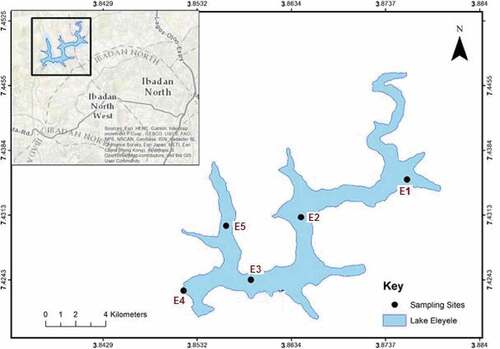
Table 1. The mean ± SD values of water quality parameters in Eleyele Lake, Nigeria 2017. The NSDQW and WHO values are added for comparison
Table 2. Spatial and temporal analysis of water quality parameters in Eleyele Lake, Nigeria 2017. Significant values (p < 0.05) are marked*
Table 3. The mean ± SD concentrations of heavy metals in water (mg/L) of Eleyele Lake, Nigeria 2017. The NSDWQ and WHO values are added for comparison
Table 4. The mean ± SD concentrations of heavy metals in sediments (mg/kg) of Eleyele Lake, Nigeria 2017. The USEPA values are added for normative comparison
Table 5. Spatiotemporal analysis of metals in water and sediments in Eleyele Lake, Nigeria 2017. *p < 0.05 indicate significant values
Table 6. Bioconcentration factors of metals in Eleyele Lake, Nigeria 2017. Bioconcentration of metals classified as low<250, moderately high 250–1000 and high >1000
Table 7. Pollution Load Index (PLI) for metals in surface sediments of Eleyele Lake, Nigeria 2017. Polluted sites (PLI>1) are marked*
Table 8. Geoaccumulation Index (Igeo) for metals in surface sediments of Eleyele Lake, Nigeria 2017. Copper showing extreme contamination (Igeo) >5 is marked*
Table 9. Potential Ecological Risk Index (PERI) for metals in surface sediments of Eleyele Lake, Nigeria 2017. Nickel showing significantly high serious ecological risk RI≥600 is marked*
Table 10. Metal concentrations in tissues of the African Sharptooth mud catfish (N = 34; Mean weight = 0.845 ± 0.28 kg) and Nile Tilapia (N = 36; Mean weight = 0.437 ± 0.45 kg) sampled in Eleyele Lake 2017. Food and Agriculture Organization (Citation1983) limits are also shown for comparison
Table 11. Spatio-temporal analysis of metals in gills and stomach tissues of fish in Eleyele Lake, Nigeria 2017. *p < 0.05 indicate significant values