Figures & data
Figure 1. Map of Kumasi showing surrounding district assemblies.
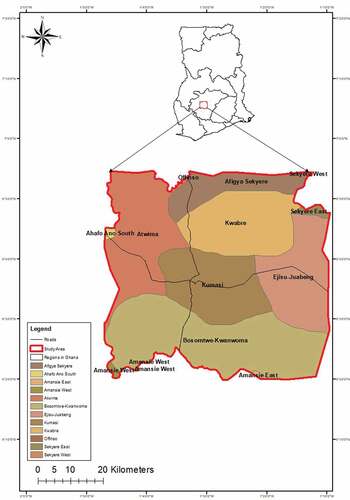
Table 1. Summary of the Landsat data sets used in the analysis
Figure 2. Presence of scan-line and without scan line.
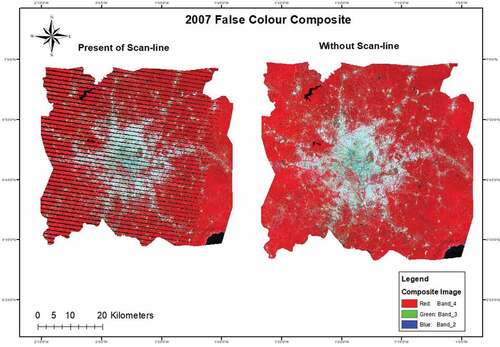
Figure 3. Classified land cover maps for 1986, 2007 and 2015.
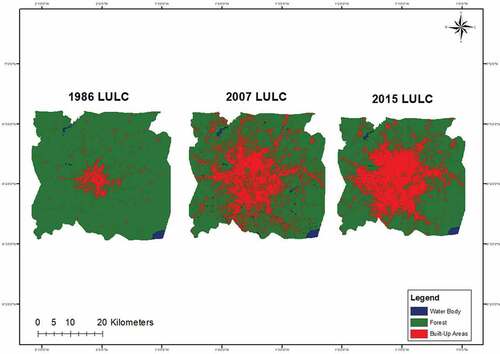
Table 2. LULC change analysis from 1986 to 2007
Table 3. LULC change analysis from 2007 to 2015
Table 4. LULC change analysis from 1986 to 2015
Figure 4. Population pattern in Kumasi since 1984 (Source: Kumasi metropolitan assembly, 2016).
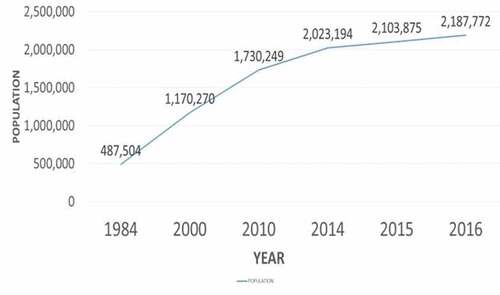
Figure 5. Parts of Fante newtown park destroyed for commercial activities (Source: Mensah, Citation2014b).
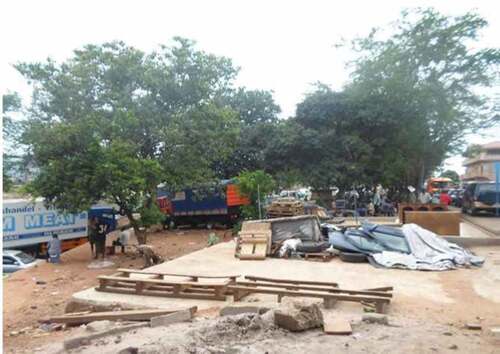
Figure 6. Thermal map of Kumasi in January of 1986, 2007 and 2015. Where KMA refers to the Kumasi metropolitan assembly and AMM also refers to the Asokore Mampong Municipal.
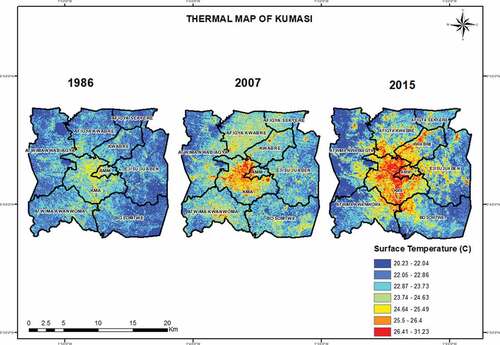
Table 5. Mean LST for each governmental administrative district across Kumasi (1986–2015)
Table 6. The maximum, minimum and mean LST for Kumasi (1986–2015)
Figure 7. The trend of the mean annual minimum temperature from 1986–2015 for Kumasi.
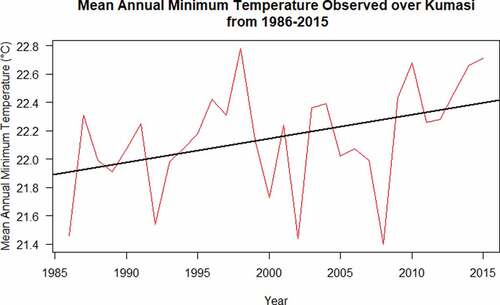
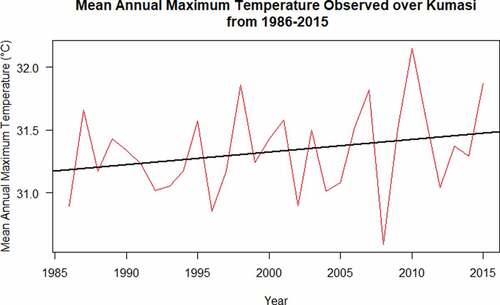
Figure 8. The trend of the mean annual maximum temperature from 1986–2015 for Kumasi.