
Figures & data
Figure 1. Study sites used for sample data collection in Waterloo, ON: Columbia Street (Col) and Ring Road (RR).
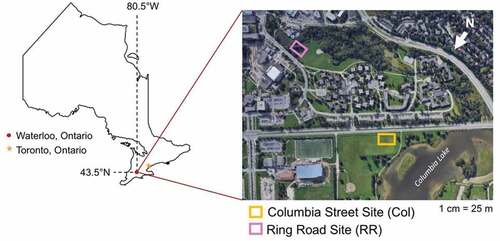
Figure 2. Cross sections for the Columbia (Col) study site (a) and the Ring Road (RR) study site (b).
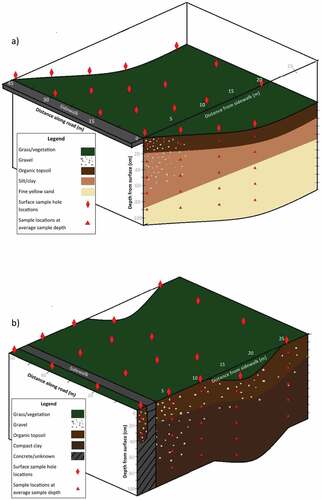
Table 1. Maximum allowable heavy metal concentrations in soil, as stated in the Ontario Nutrient Management Act (O. Reg. 338/09)
Figure 3. Heavy metal concentrations with distance from the edge of the road in samples collected from the upper 20 cm of the soil profile. Data is plotted in reference to an allowable concentration in uncontaminated soils (shown as a red line) as stated in the Ontario Nutrient Management Act.
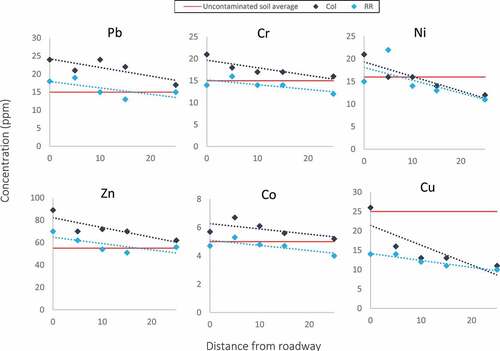
Figure 4. Phosphorous concentration with depth for Col Winter samples (top left), Col Summer samples (top right), RR Winter samples (bottom left), and RR Summer samples (bottom right). Logarithmic trendlines are superimposed upon all samples with the exception Col W-5 and Col S-5, which only have data from the first two depth intervals.
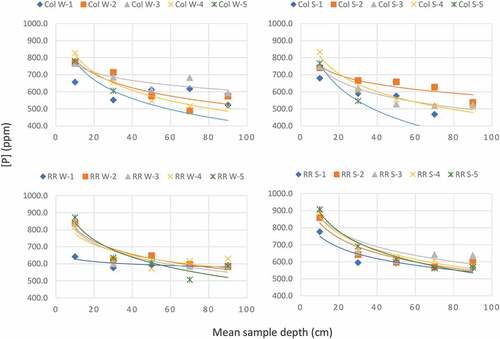
Table 2. Results of K-W Test performed on Col Winter, Col Summer, RR Winter, and RR Summer samples at each depth interval
Table 3. Spearman rank coefficients comparing concentration of phosphorous with distance from the curb for each of Col W, RR W, Col S, and RR S
Figure 5. Phosphorus concentration with distance from the road for all samples considering all depths. Linear trendlines are shown as a dotted line for winter samples and a dashed line for summer samples.
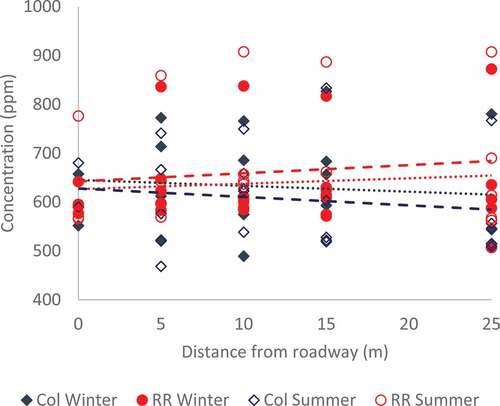
Figure 6. Total phosphorus of soils in cross section (Total phosphorous in ppm) for RR Winter (top left), RR Summer (top right), Col Winter (bottom left), and Col Summer (bottom right).
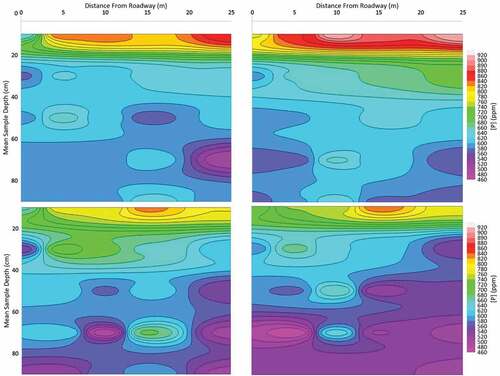
Figure 7. a) and b).Phosphorus concentrations of snow pack samples (a) and runoff samples (b) comparing SRP and TP.
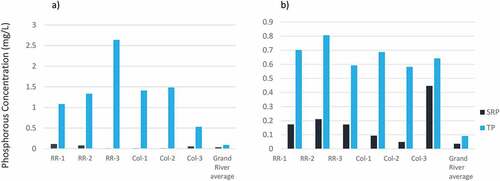
Figure 8. Compiled Total Phosphorus (TP) and Soluble Reactive Phosphorus (SRP) (also Dissolved Phosphorus (DP)) concentrations in runoff from various studies and the current study. Percentiles for SRP and TP in the current study are shown in Table . The locations of the data shown in this figure are as follows: Pitt et al. (Citation2004) : Average concentrations across USA, where “mixed” indicates various land uses but one which is dominant; for example, “mixed commercial” indicates regions which are primarily used for commercial purposes. Pitt et al. (Citation2004) : Denver 1980 and 1992—average concentrations for the city of Denver, CO, USA in years 1980 and 1992; collected from various land use regions. Li et al. (Citation2008) : Austin, Texas, USA, and College Station, Texas, USA; concentrations from commercial samples. NSQD: National Stormwater Quality Database (Citation2014) : Average concentration across USA for samples collected on freeways, as tabulated by the National Stormwater Quality Database. Goonetilleke et al. (Citation2005) : Southeast Queensland State, Australia; samples collected from residential regions. Bryan (Citation1974) : Durham, North Carolina, USA; sample from a primarily commercial region.
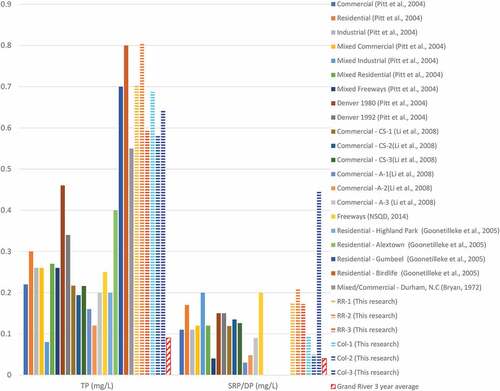
Table 4. Percentiles ranks of TP and SRP data shown in Fig. 7