Figures & data
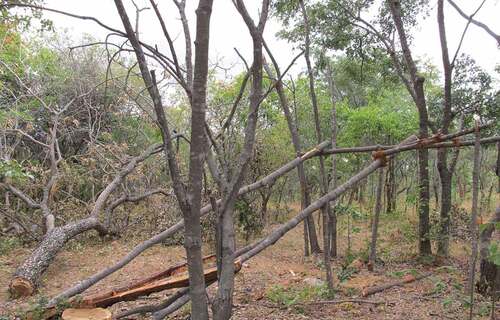
Figure 1. Map of the study area (green dots in the second figure show sample plots).
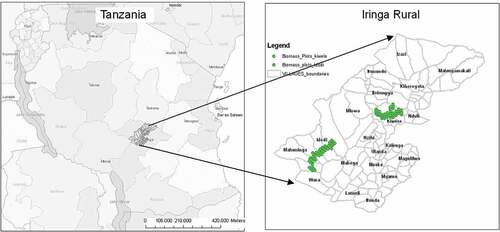
Table 1. Allometric equations used for AGB and volume
Figure 2. Overall share of tree cuttings for different purposes: (a) Number of stumps per ha (left) and (b) biomass (ton ha−1) (right).
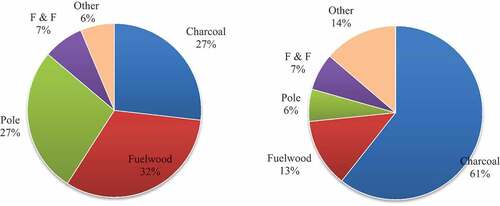
Figure 3. Representation of BA (m2ha−1), volume (m3ha−1) and biomass (ton ha−1) for fresh and old cuts in both areas.
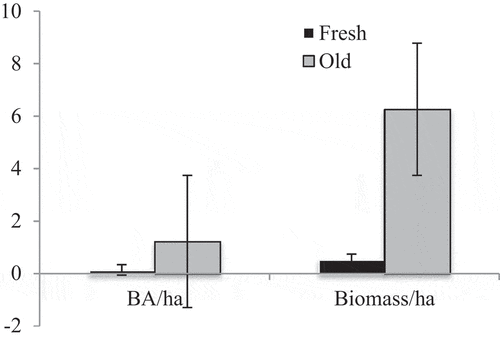
Table 2. Independent and dependent variable used for the analysis
Table 3. Comparison of mean ± standard error no ha−1, BA ha−1 and volume ha−1 in two areas
Table 4. Mean biomass estimated from four different allometric equations
Figure 4. Number of stumps per ha plotted against distance to forest edge (m).
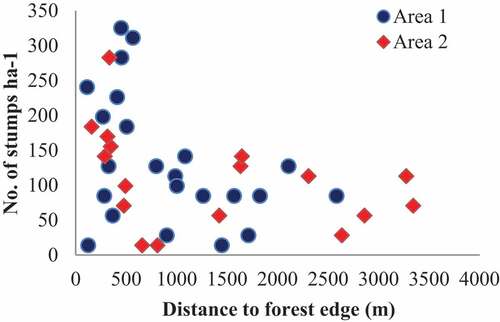
Table 5. Logistic regression of forest degradation (presence or absence) with distance parameters in meters (df = 57)
Table 6. Relationship of stump cutting (number per ha) with distance parameters in meters
Figure 5. Basal area ha−1 plotted against distance to settlement (m).
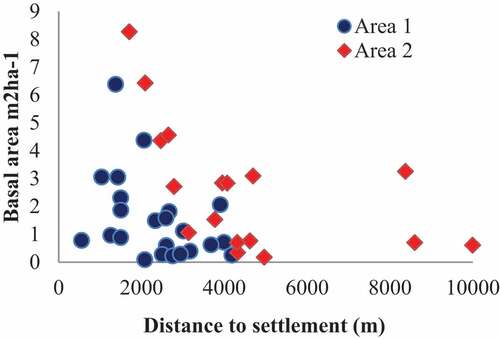
Figure 6. Percentage basal area removed plotted against distance to settlement (m).
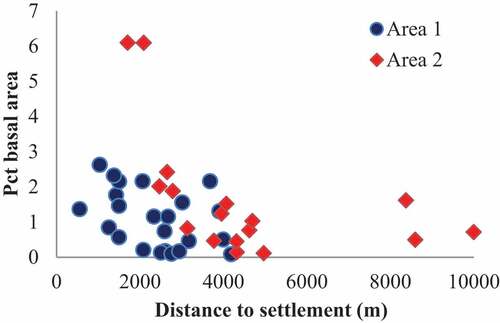
Table 7. Relationship of tree cuttings (basal area m2 per ha) with distance parameters (m)
Table 8. Percentage basal area removed per hectare regressed against distance parameters (m)
Figure 7. Availability of stumps removed for charcoal with respect to the distance from settlements in both areas.
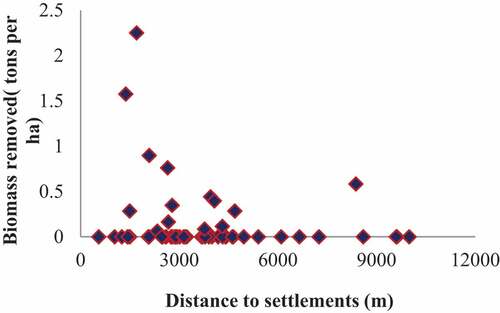
Table 9. Relationship of charcoal presence with respect to distance parameters (df = 57)
Table 10. Relationship of tree cutting for fuelwood with respect to the distance factors (df = 57)
Figure 8. Distribution of biomass removed (tons ha−1) for fuelwood and pole distance from settlements in both areas.
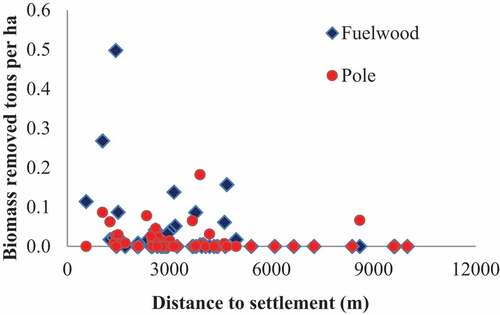
Table 11. Relationship of tree cutting for poles with distance parameters (df = 57)