
Figures & data
Figure 1. Study area map.
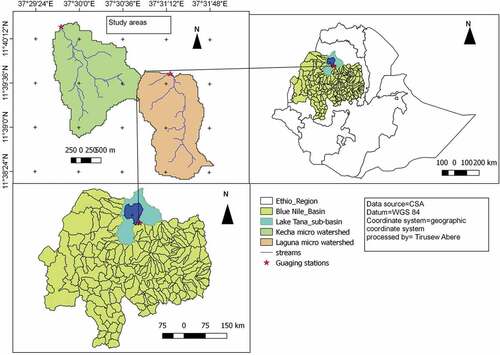
Table 1. Description of LULC types identified in the Kecha-Laguna micro watersheds, Northwestern highlands of Ethiopia
Table 2. Land use/cover types and areas covered in Kecha micro watershed in four different years (1957, 1984, 2006 and 2016)
Table 3. Magnitude of Land use cover change in Kecha micro watershed in five different periods
Table 4. Rate of land use/cover change in Kecha micro watershed for the four periods
Table 5. LULCC matrices of Kecha micro watershed (1957–1984)
Figure 2. Land use/cover map of Kecha micro watershed (1957 and 1984).
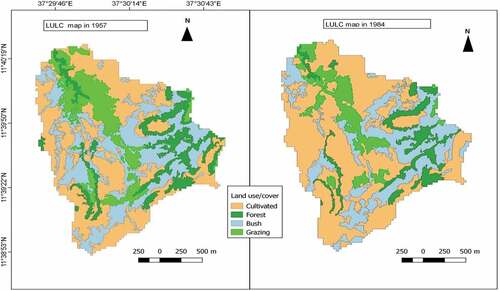
Figure 3. Land use/cover map of Kecha micro watershed in 2006 and 2016.
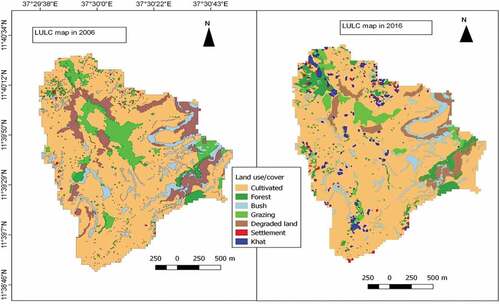
Table 6. LULCC matrices of Kecha micro watershed (1984–2006)
Table 7. LULCC matrices of Kecha micro watershed (2006–2016)
Table 8. Land use/cover types and areas covered in Laguna micro watershed in three different periods (1957, 2006 and 2016)
Table 9. Magnitude of Land use/cover change and rate of change in the Laguna micro watershed on the three different periods
Table 10. LULCC matrices for Laguna micro watershed (1957–2006)
Figure 4. Land use/cover map of Laguna micro watershed in 1957, 2006 and 2016.
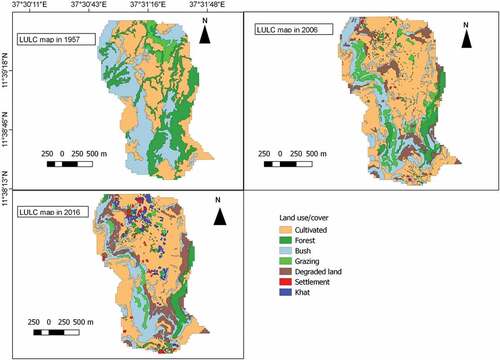
Table 11. LULCC matrices for Laguna micro watershed (2006–2016)