Figures & data
Figure 1. Conceptual framework.
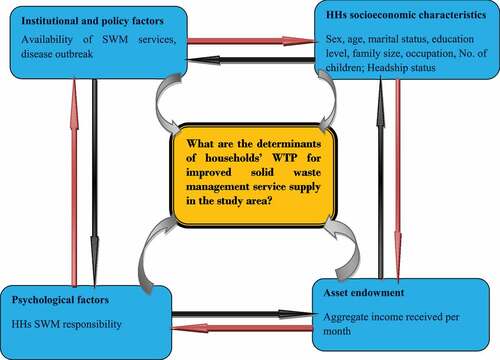
Figure 2. Map of the study area.
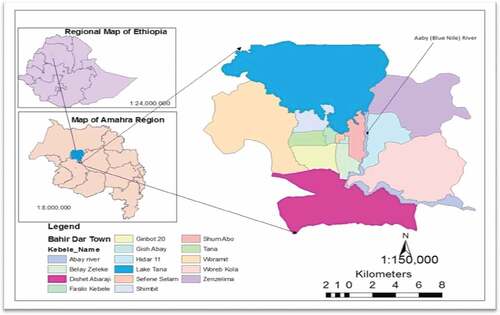
Table 1. CV Formats and Econometric models used for analysis
Table 2. Definition, descriptive statistics and expected sign of variables
Table 3. WTP for improved SWM services in Bahir Dar city
Figure 3. Reasons for not WTP for better SWM services.
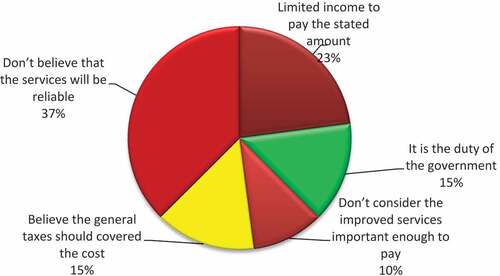
Table 4. Estimating total WTP for the different household income groups
Figure 4. Estimated Demand curve for improved SWM services Source: survey results, 2018.
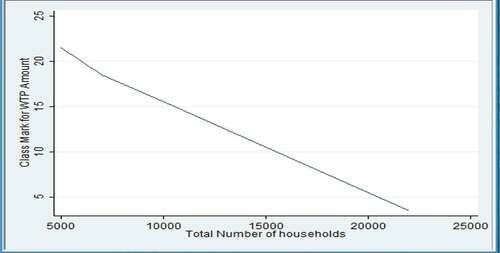
Table 5. Expected Aggregate Revenue
Table 6. Determinants of Households’ for better SWM services