Figures & data
Figure 1. Ship energy efficiency management tools including EEOI: Energy Efficiency Operational Indicator; EEDI: Energy Efficiency Design Index; SEEMP: Ship Energy Efficiency Management Plan.
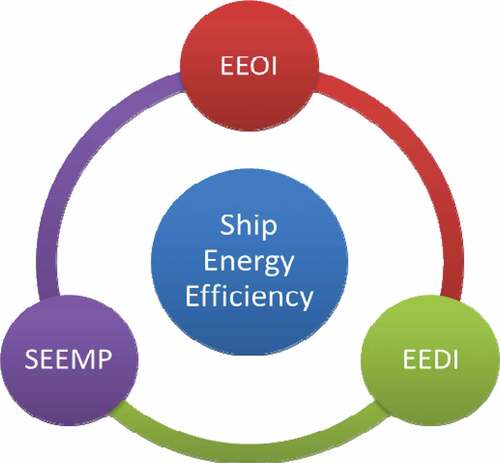
Figure 2. A certain bulk carrier, M/V NSU JUSTICE of VINIC shipping transportation company, Vietnam.

Table 1. The specific parameters of a certain bulk carrier
Figure 3. Bridge room.
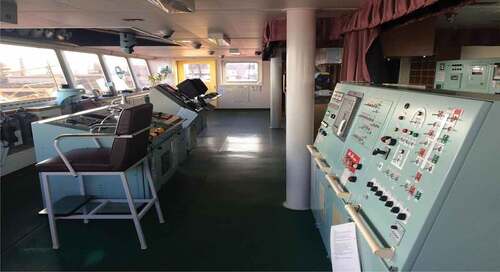
Figure 4. Engine room.
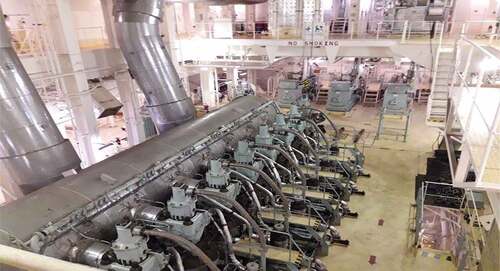
Figure 5. Flow meter.
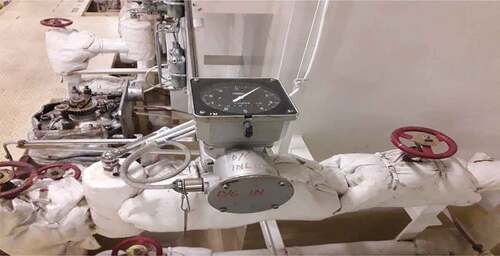
Figure 6. GPS device.
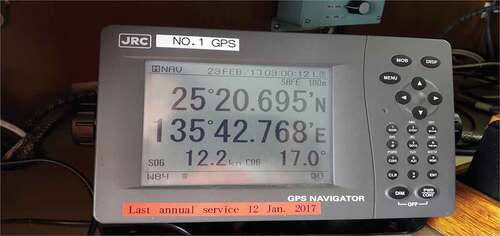
Figure 7. Navigation environment parameter meters.

Table 2. The detail information of data collected from a bulk carrier
Table 3. The values of variable factors of bulk carrier
Table 4. Samples from Monte Carlo simulation method
Table 5. The sample mean and standard deviation of samples
Figure 8. Box plot for HFO consumption.
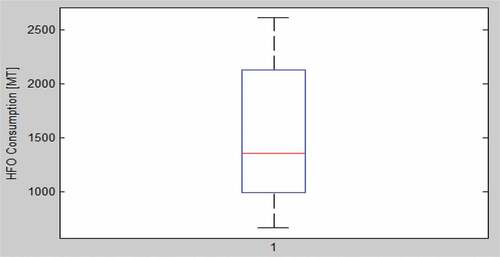
Figure 9. Box plots for DO consumption.
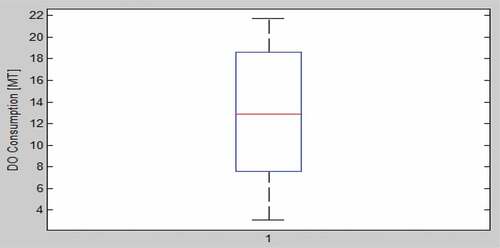
Figure 10. Box plot for cargo carried.
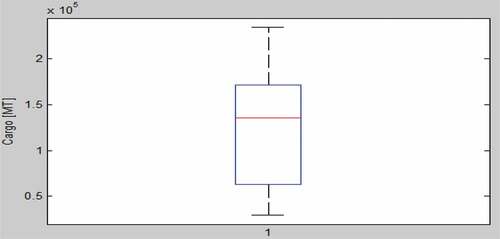
Figure 11. Box plot for distance traveled.
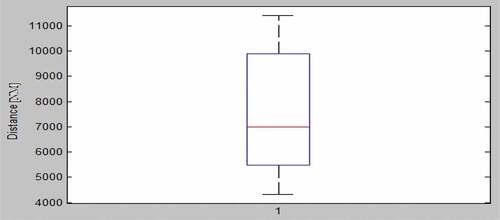
Table 6. The finite element data of each investigated parameter
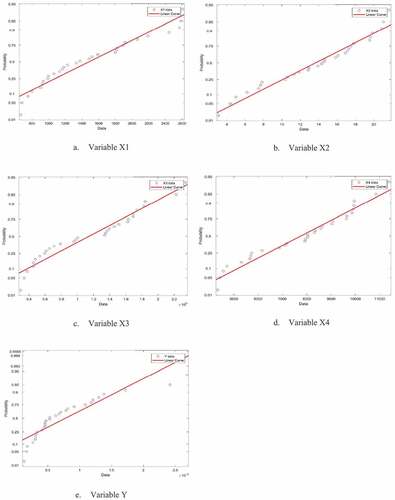
Figure 12. Distribution data of sample variables Xi(i = 1 ÷ 4) and Y through novelty simulation method.
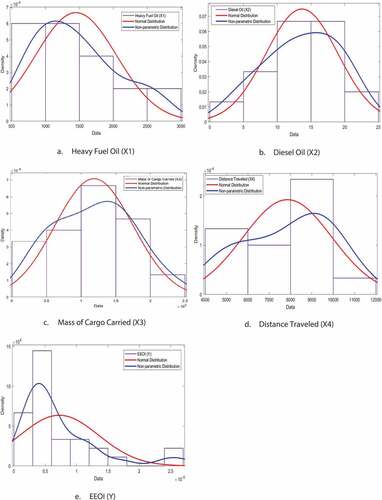
Figure 13. The number of record of fuel oil consumption (Unit: MT).
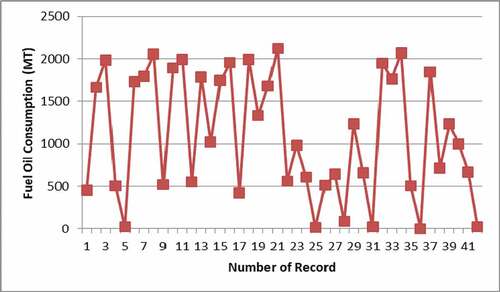
Figure 14. The characteristics curve between fuel oil consumption and ship speed.
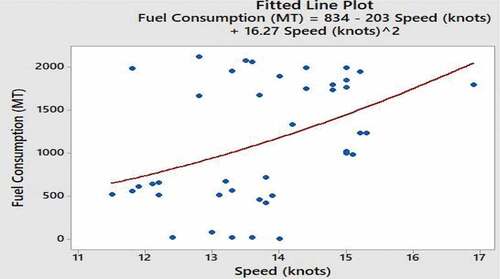
Figure 15. EEOI index from the actual operation data.
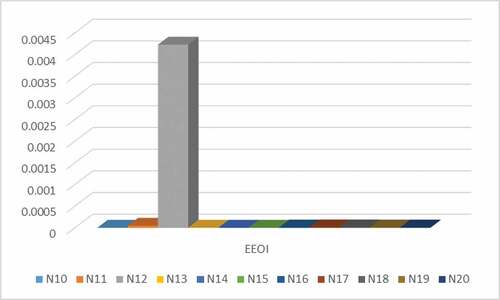
Figure 16. Wave height and wind speed of Voyage N10.
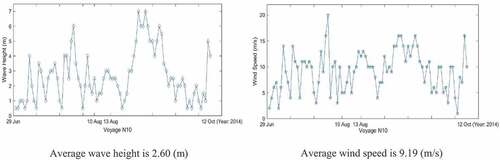
Figure 17. Wave height and wind speed of Voyage N11.
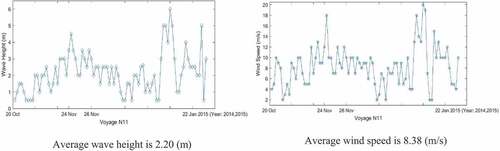
Figure 18. Wave height and wind speed of Voyage N12.
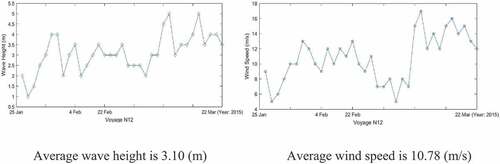
Figure 19. Wave height and wind speed of voyage N13.
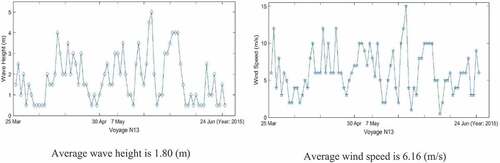
Figure 20. Wave height and wind speed of Voyage N14.
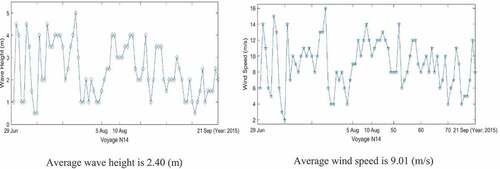
Figure 21. Wave height and wind speed of Voyage N15.
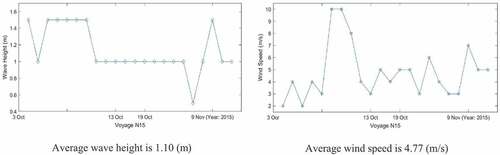
Figure 22. Wave height and wind speed of Voyage N16.
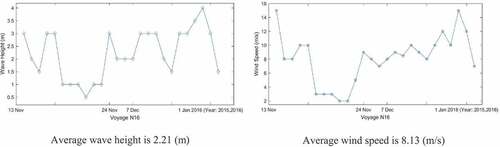
Figure 23. Wave height and wind speed of Voyage N17.
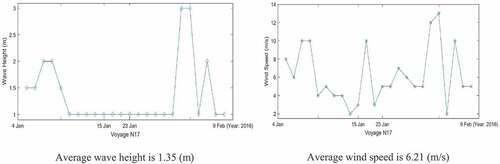
Figure 24. Wave height and wind speed of Voyage N18.
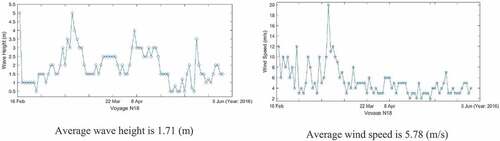
Figure 25. Wave height and wind speed of Voyage N19.
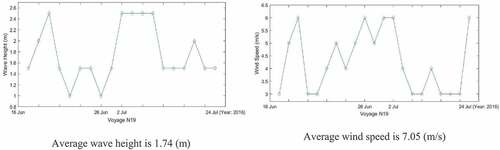
Figure 26. Wave height and wind speed of Voyage N20.
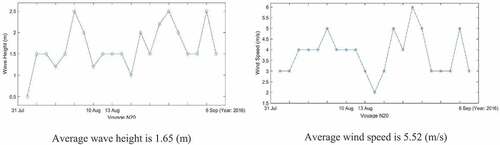
Figure 27. The average wave height and wind speed following different voyages.
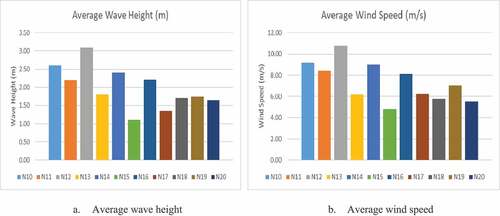
Table 7. Average weather condition of voyages
Table 8. EEOI index calculated for each voyage
Figure 28. Prediction curves of variables through the novelty simulation method.