Figures & data
Figure 1. Geographic location of the study districts.
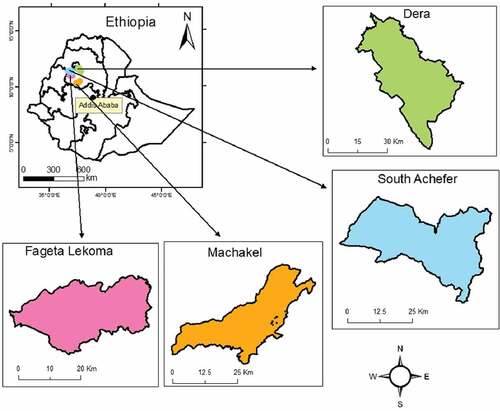
Table 1. Farmers’ experience on lupin cropping explained as percentage or mean value depending on the type of measurement employed
Figure 2. Comparisons of common legumes grown in the study area usually done by the farmers to choose among the legumes to put into the rotation scheme. Parameters considered are: N2 = Nitrogen fixation capacity; Input = Input requirement; Drought = Drought adaptation/resilience; Disease = Disease resistance; Insect = Insect pest resistance; Weed = Weed tolerance; GY = Grain yield; SY = Stubble yield; and RU = Residue utilization.
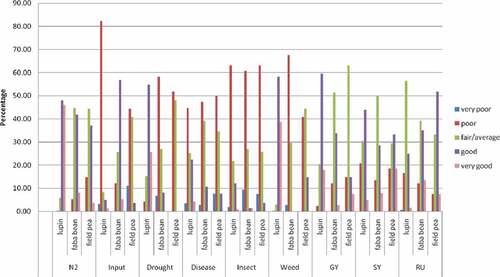
Table 2. Farmers’ experience and evaluation of lupin as feed expressed as percentage
Table 3. Sources and access of agricultural and market information for farmers, expressed as percentage or mean value depending on the type of measurement employed