Figures & data
Figure 1. The building blocks of a systems approach to describing atmosphere and pedosphere ecosystem services exchange (based on Groshans et al., Citation2019) from which agriculture (e.g., farms etc.) receives ecosystem services (e.g., provisioning: food, fiber etc.) flows, and transforms them into various commodities with identified market value. This transformation can be accompanied by greenhouse gas emissions (e.g., CO2 etc.), which can be valued based on social costs of carbon dioxide emissions (SC-CO2).

Table 1. Example of agricultural users, scale of use, and probable uses of SC-CO2 values associated with soil organic carbon (SOC), soil inorganic carbon (SIC), and total soil carbon (TSC) in relation to Sustainable Development Goals (SDGs) (based on Tugel et al., 2005)
Figure 2. The “soil carbon hotspot” concept—an intersection between high soil carbon and disturbance (based on Bétard & Peulvast, Citation2019).
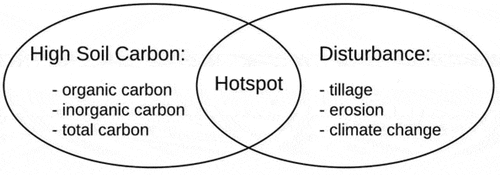
Table 2. Soil types within Willsboro Farm, Willsboro, NY
Figure 3. Map of Willsboro Farm, Willsboro, NY (Essex County) with the following soil types: Entisols (Claverack loamy fine sand, 3% to 8% slopes, CqB; Cosad loamy fine sand, 0% to 3% slopes, CuA; Deerfield loamy sand, 0% to 3% slopes, DeA; Stafford fine sandy loam, 0% to 3% slopes, StA), Inceptisols (Amenia fine sandy loam, 2% to 8% slopes, AmB; Massena gravelly silt loam, 3 to 8% slopes, McB; Nellis fine sandy loam, 3% to 8% slopes, NeB; Nellis fine sandy loam, 8% to 15% slopes, NeC), and Alfisols (Bombay gravelly loam, 3% to 8% slopes, BoB; Churchville loam, 2% to 8% slopes, CqB; Covington clay, 0% to 3% slopes, CvA; Howard gravelly loam, 2% to 8% slopes, HgB; Kingsbury silty clay loam, 0% to 3% slopes, KyA; Kingsbury silty clay loam, 3% to 8% slopes, KyB).
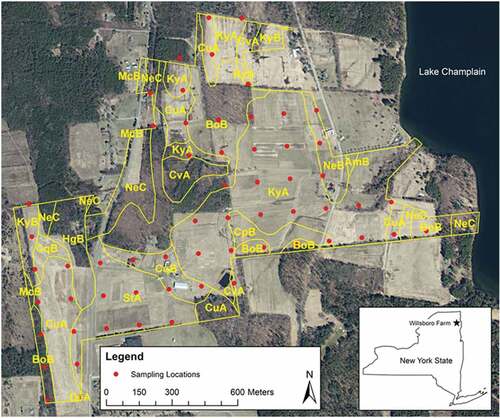
Table 3. A conceptual overview of the accounting framework used in this study (adapted from Groshans et al., 2019)
Table 4. Total and area-normalized monetary values of soil organic carbon (SOC), soil inorganic carbon (SIC), and total soil carbon (TSC) storage by soil type and soil order from SSURGO (2015) at the Willsboro Farm (NY), based on a social cost of carbon (SC-CO2) of $42 per metric ton of CO2 (EPA, 2016)
Table 5. Total and area-normalized values of soil organic carbon (SOC), soil inorganic carbon (SIC), and total soil carbon (TSC) storage by soil type and soil order from averaged soil core results (original data from Mikhailova et al., 1996) at the Willsboro Farm (NY), based on a social cost of carbon (SC-CO2) of $42 per metric ton of CO2 (EPA, 2016)
Table 6. Total and area-normalized values of soil organic carbon (SOC), soil inorganic carbon (SIC), and total soil carbon (TSC) storage by soil type and soil order from interpolated soil core results (original data from Mikhailova et al., 1996) at the Willsboro Farm (NY), based on a social cost of carbon (SC-CO2) of $42 per metric ton of CO2 (EPA, 2016)
Figure 4. Value of total soil carbon (TSC) (based on mean) by different pools (SOC=soil organic carbon, SIC=soil inorganic carbon) at the Willsboro Farm, Willsboro, NY: (a) based on SSURGO database (soil depth range: 183–236cm), (b) based on interpolated field measurements (soil depth range: 30–115cm) based on soil C numbers from Mikhailova et al. (Citation2016) and a SC–CO2 of $42 per metric ton of CO2 (EPA, Citation2016).
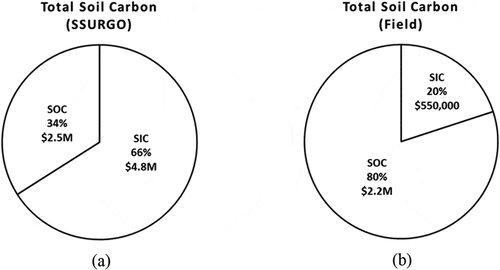
Table 7. Comparison of mean area-normalized values of soil organic carbon (SOC), soil inorganic carbon (SIC), and total soil carbon (TSC) storage by soil order from STATSGO (based on numbers from Guo et al., 2006), SSURGO, and field sampling at the Willsboro Farm (NY), based on a social cost of carbon (SC-CO2) of $42 per metric ton of CO2 (EPA, 2016)
Figure 5. Value of total soil carbon (TSC) (based on mean) based on a SC-CO2 of $42/metric ton of CO2 at the Willsboro Farm, Willsboro, NY: (a) based on SSURGO database (soil depth range: 183–236 cm), (b) based on averaged field measurements (soil depth range: 30–115 cm).
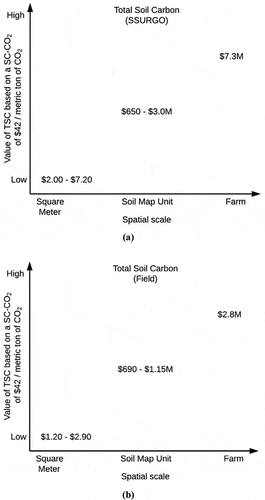
Figure 6. Value of soil organic carbon (SOC) based on a SC-CO2 of $42/metric ton of CO2 at the Willsboro Farm, Willsboro, NY: (a) from SSURGO results averaged over SMUs, (b) interpolated from soil core sample results.
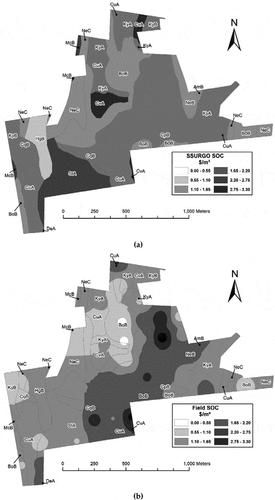
Figure 7. Value of soil inorganic carbon (SIC) based on a SC-CO2 of $42/metric ton of CO2 at the Willsboro Farm, Willsboro, NY: (a) from SSURGO results averaged over soil map units (SMUs), (b) interpolated from soil core sample results.
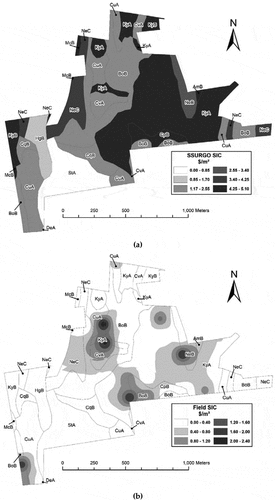
Figure 8. Value of total soil carbon (TSC) based on a SC-CO2 of $42/metric ton of CO2 at the Willsboro Farm, Willsboro, NY: (a) from SSURGO results averaged over soil map units (SMUs), (b) interpolated from soil core sample results.
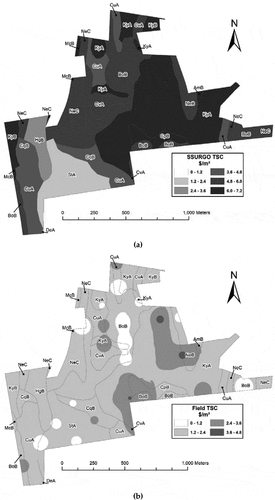
Table 8. The proportion of the area occupied by different management zones according to the SSURGO database, and field data based on interpolation of soil core sample results for soil organic carbon (SOC), soil inorganic carbon (SIC), and total soil carbon (TSC)
