
Figures & data
Figure 1. GIS map of the study area
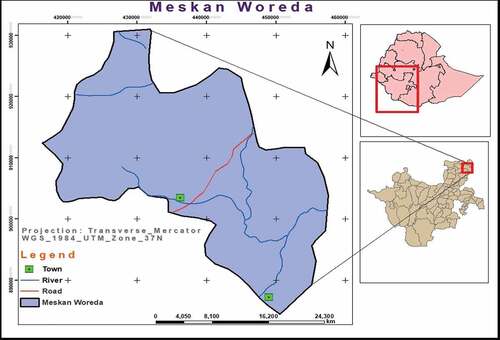
Table 1. Definition and descriptive statistics of socioeconomic and demographic variables
Table 2. Distribution of yes and no responses for initial and/or follow up bid value
Table 3. Means of money payment for WTP
Table 4. Estimates of the double-bounded dichotomous choice format
Table 5. Frequency distribution of the open-ended format
Table 6. Summary of WTP and its aggregate values
Figure 2. Estimated demand curve for improved irrigation water supply
Source: Own survey result, 2018
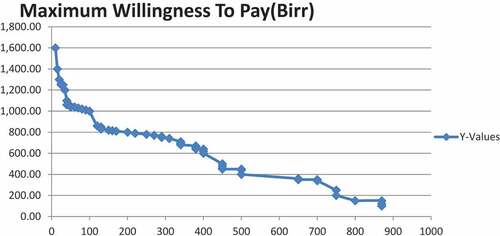
Table A1. Conversion factors used to estimate man equivalent
Table A2. Conversion factors used to estimate Tropical Livestock Units (TLU)