Figures & data
Figure 1. Location map of the study area
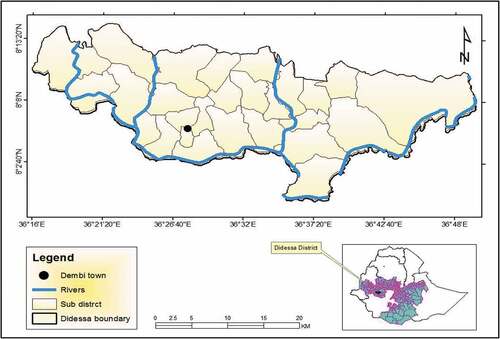
Figure 2. Description map of study area. (a) Topographic structure of the study area. (b) Population density map. (c) Land use land cover map of the study area. (d) Spatial distributions of health institutions
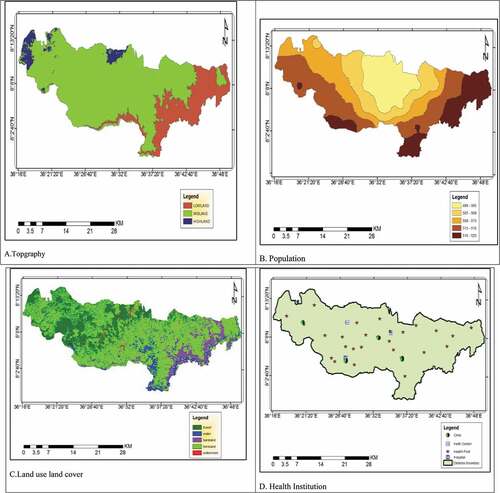
Figure 3. General frame work of the research study
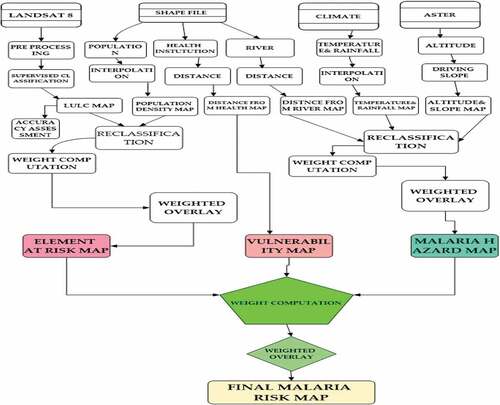
Table 1. Different types of data sources and their resolutions
Table 2. Saaty’s pairwise comparison table with 9 degrees
Table 3. Consistency index interpretation (Saaty & Vargas, Citation2001)
Figure 4. Malaria risk occurrence factors. (a) Temperature (b) Precipitation (c) Slope (d) Altitude (e) DTR (f) Population (g) Land use land cover (h) Proximity to health centers
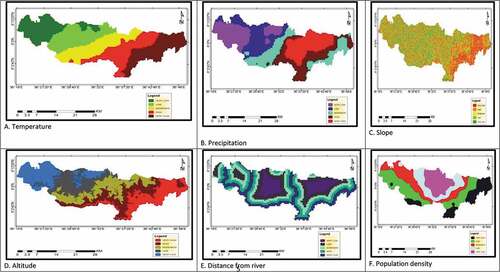
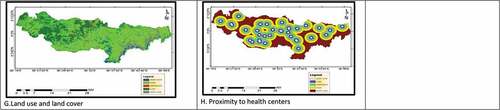
Figure 5. Spatial malaria risk level distribution (a) Malaria hazard (b) Element at risk (c) Malaria risk
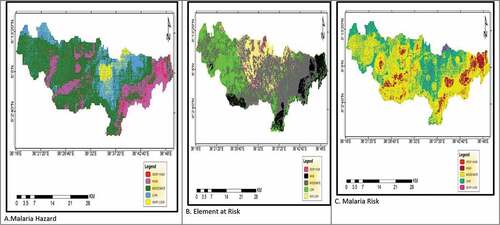
Figure A1. Malaria hazard AHP weight derivation
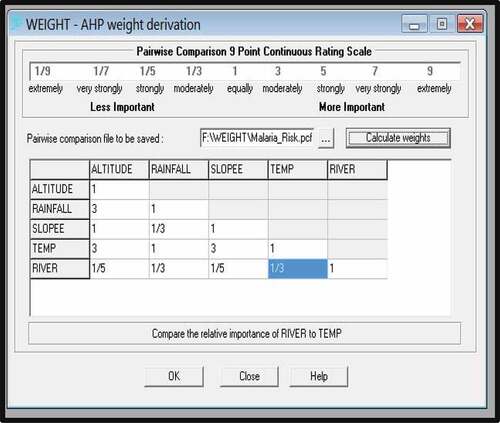
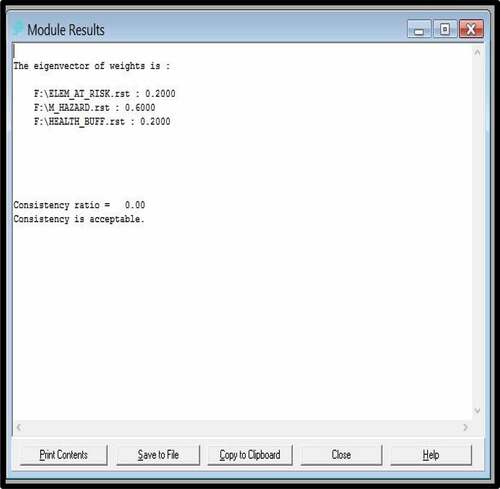
Figure A2. Modle results of malaria hazard risk factors weight description
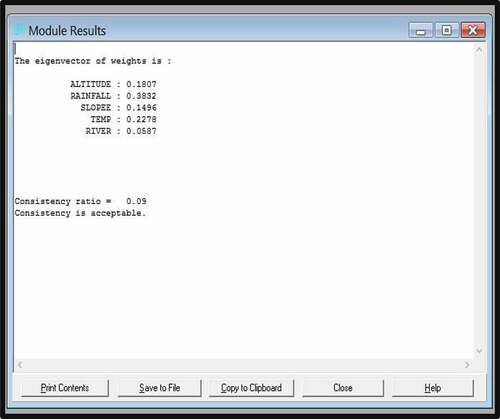
Figure A3. Malaria risk map AHP weight derivation
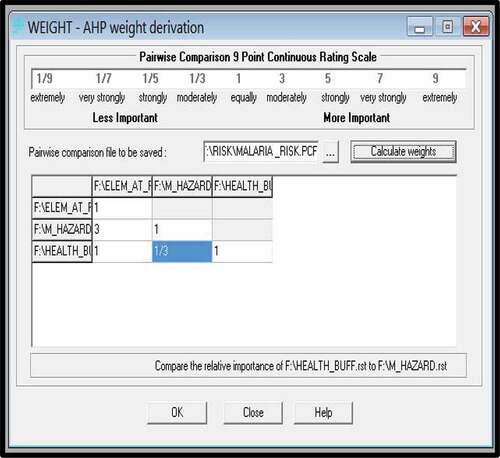
Figure A4. Module results of overall malaria risk factors weight description