
Figures & data
Figure 1. Basic structure of PCDD and PCDF
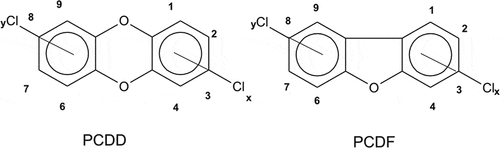
Table 1. Comparison of year 1985 maximum dioxins emission estimates with year 2000 emission and 2005 estimates of PCDD/Fs emissions in Europe
Table 2. Global breakdown of peatland areal coverage
Table 3. Average concentrations of major and trace elements (mg/kg) in peat
Table 4. Total PCDD/Fs, PCBs and PAHs in raw temperate peat samples
Table 5. Total PCDD/Fs in related samples