
Figures & data
Figure 1. Experimental layout at the University of Fort Hare Research Farm
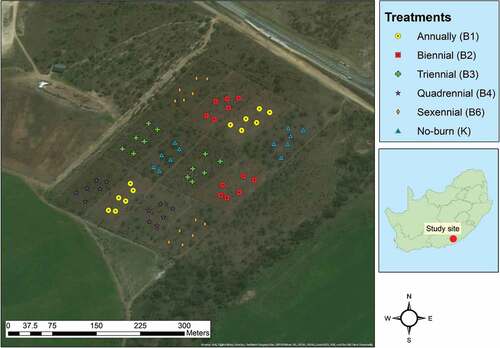
Table 1. Mean values (mg kg−1) of selected micronutrients and C, N, C:N ratio and P in various burning treatments
Table 2. Mean values of pH and base cations of various burning treatments
Table 3. Pearson correlation matrix between various soil chemical properties