Figures & data
Table 1. Student’s variables
Figure 1. Sectorization per cost of enrollment
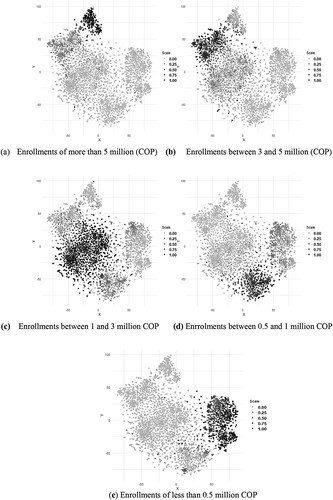
Figure 2. Sectorization per type of HEI
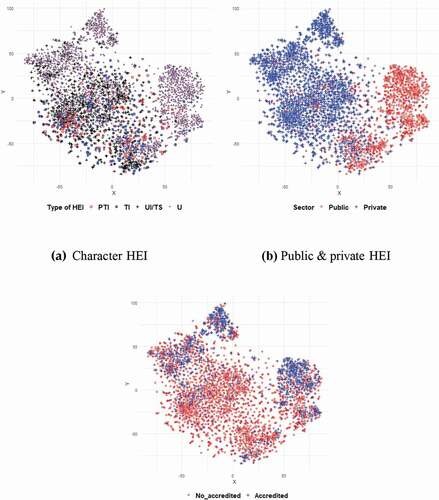
Table 2. Percent distribution of the programmes in each one of the clusters
Figure 3. Display t-SNE by clusters
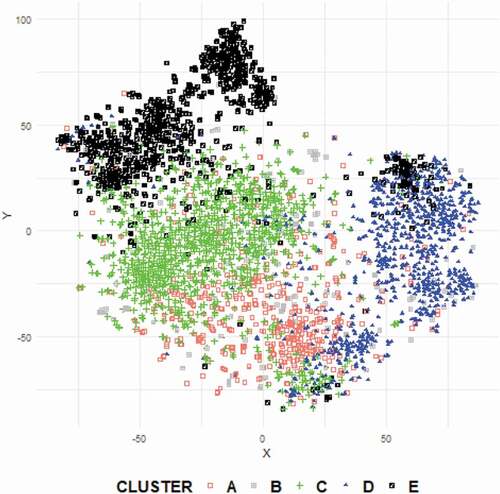
Figure 4. Distribution in clusters (Accreditation, method, proportion of: student workers, parents with university degree
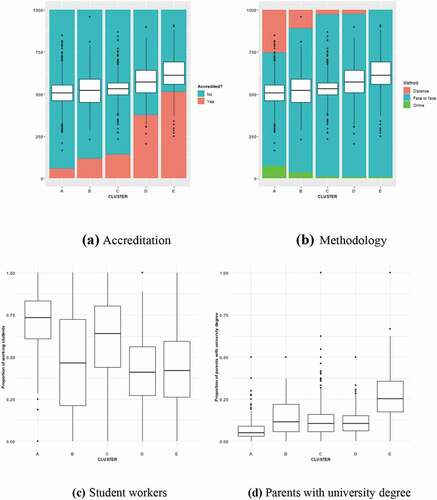
Table 3. Distribution of programme areas throughout the clusters
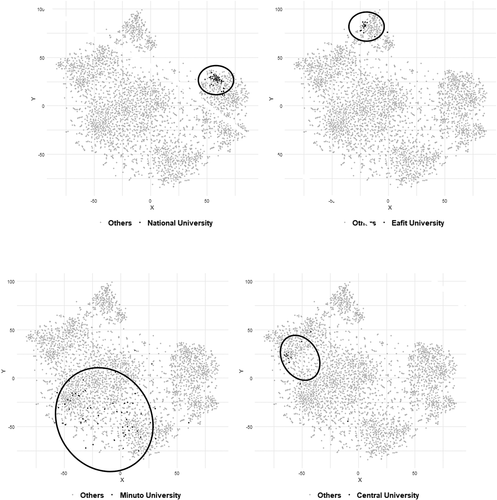
Examples of the visualisation of programmes grouped by HEI in the cloud t-SNE