Figures & data
Table 1. Research procedures used
Figure 1. Summary of the search process performed
Source: Prepared by the authors
Figure 2. Annual scientific production on the use of the BSC methodology in the education sector
Source: Prepared by the authors
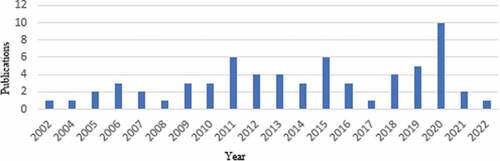
Table 2. Journals that publish research on the BSC in the education sector
Table 3. Distribution of authors by number of publications
Figure 3. Sankey diagram relating authors (middle), author’s keywords (left side) and cited references (right side)
Source: Prepared by the author using Biblioshiny
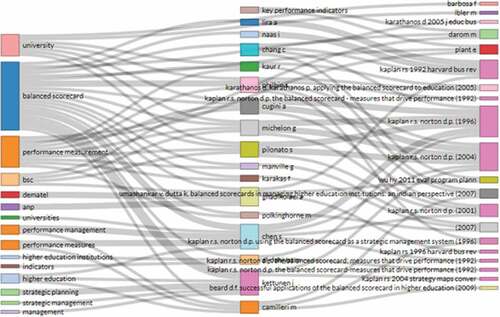
Table 4. Research methods on the use of BSC methodology in the education sector
Figure 4. Cumulative frequency of keywords used over time in the BSC theme applied to the education sector
Source: Prepared by the authors using Biblioshiny
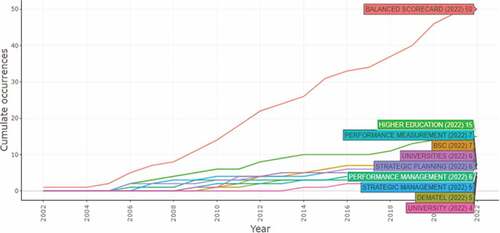
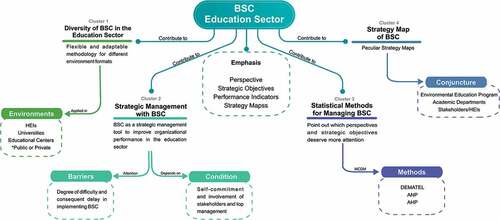
Figure 5. Clusters found in the literature on the BSC in the education sector
Source: Prepared by the authors
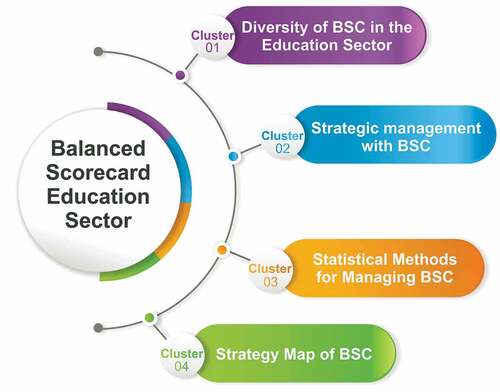
Figure 6. Framework for BSC in the education sector
Source: Prepared by the authors