
Figures & data
Figure 1. Conceptual framework showing the relationship between activities and their corresponding occupation in Ghana.
ALT TEXT: Twelve rectangular images used to represent six groups of activities leading to their specific six groups of occupations and the interrelationship between them.
Source: Authors’ constructs based on the review of literatureKey: ACTSC1 = Mechanical- Technological Activities, ACTSC2 = Mathematical Computation activities, ACTSC3 = Managerial- Clerical Activities, ACTSC4 = Science Research Activities, ACTSC5 = Persuasive- Enterprising Activities, and ACTSC6 = Fine Art activities.OCCSC1 = Mechanical- Technological Occupation, OCCSC2 = Mathematical Computation Occupation, OCCSC3 = Managerial- Clerical Occupation, OCCSC4 = Science Research Occupation, OCCSC5 = Persuasive- Enterprising Occupation, OCCSC6 = Fine Art Occupation.
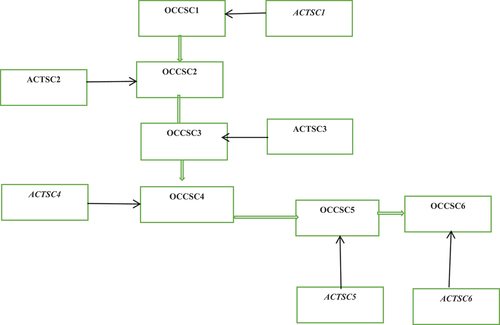
Table 1. Demographic characteristics of respondents
Table 2. Construct reliability and validity
Figure 2. An algorithm for confirmatory factor analysis
Twelve circle images representing six groups of activities and six occupations in Ghana and how they correlate with each other as well as the values for the specific items used to form the individual variables/occupations.
Source: Field survey (2022)Key: ACTSC1 = Mechanical- Technological Activities, ACTSC2 = Mathematical Computation activities, ACTSC3 = Managerial- Clerical Activities, ACTSC4 = Science Research Activities, ACTSC5 = Persuasive- Enterprising Activities, and ACTSC6 = Fine Art activities.OCCSC1 = Mechanical- Technological Occupation, OCCSC2 = Mathematical Computation Occupation, OCCSC3 = Managerial- Clerical Occupation, OCCSC4 = Science Research Occupation, OCCSC5 = Persuasive- Enterprising Occupation, and OCCSC6 = Fine Art Occupation.

Figure 3. Bootstrapping resultsfor path analysis.
Twelve circle images representing six groups of activities and six occupations with their specific items used to form them and the performance of these items or questions.
Source: Field survey (2022).
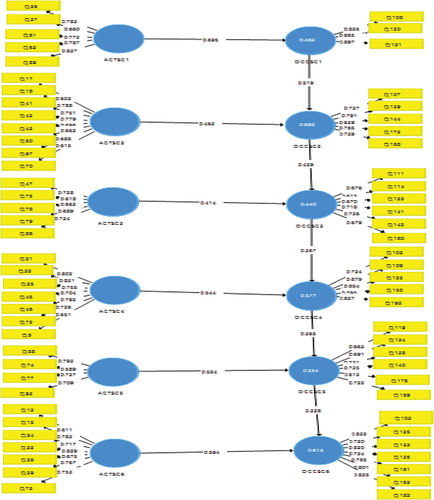
Table 3. Discriminant validity Fornell-Larcker criterion
Table 4. Inner VIF values for testing for multicollinearity among the variables
Figure 4. AQ10PLS algorithm for allitems measuring the constructsof the study and their performance
Source: Field survey (2022)
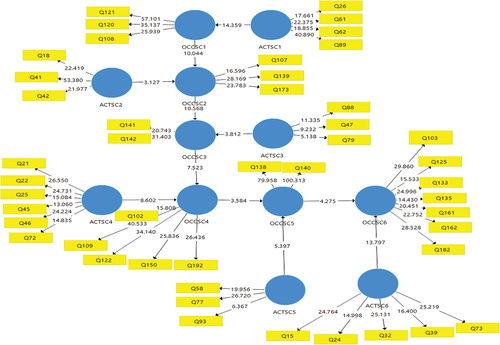
Table 5. Path coefficients