
Figures & data
Table 1. Characteristics of the participants
Table 2. Cronbach’s Alpha
Table 3. Item correlation coefficients values
Table 4. Descriptive analysis for the students’ skills engagement
Table 5. Descriptive analysis for the students’ emotional engagement
Table 6. Descriptive analysis for the students’ participation/interaction engagement
Table 7. Descriptive analysis for the students’ performance engagement
Table 8. Descriptive analysis for the students’ engagement factors
Figure 1. Descriptive Analysis of Students’ Feelings about their Virtual Learning Experience
The feelings of EFL students about their virtual learning experience during the COVID-19 pandemic, divided into four categories: very satisfied, satisfied, not satisfied, and somewhat satisfied, which is reported as the highest category.
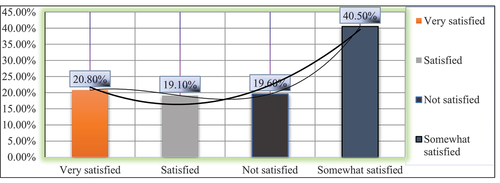
Table 9. The Anova analysis of the study variables
Table 10. Multiple comparisons—least significant differences