Figures & data
Table 1. Participants, project descriptions, and I-VR’s role
Figure 1. Screenshot of Google Earth VR’s globe hologramFootnote1.
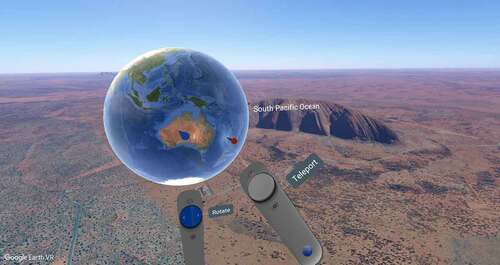
Figure 2. 6th graders’ virtual field trip platformThingLink in .
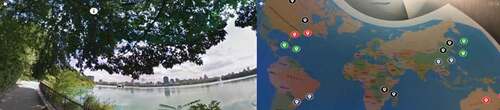
Figure 3. 5th graders’ virtual field trip platform in ThingLink.
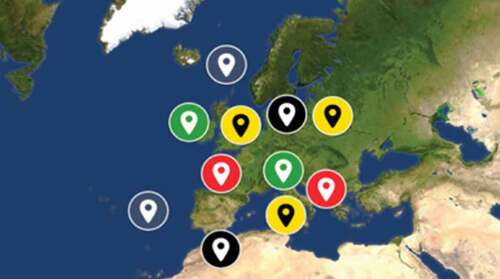
Table 2. Data collection instruments and respondents
Figure 4. The applied qualitative content analysis loop.
Table 3. Categorisation of students’ experiences (frequency of mentions)
Table 4. The actualized affordances of the I-VR system
Table 5. Students’ assessment of the I-VR system’s usability
Table 6. Students’ positive and negative emotional experiences of I-VR
Table 7. The virtual reality system’s impact on learning
Table 8. Primary school students’ definitions of virtual reality
Table 9. Themes and examples of students’ virtual worlds
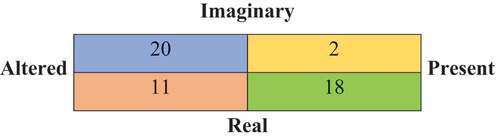
Figure 5. Space and time analysis of fantasy virtual worlds.