Figures & data
Table 1. Characteristics of the advisees (N = 128)
Table 2. Views of the advisees on the academic advising system in % (N = 128)
Table 3. Factor Analysis for components of academic advising
Table 4. Rotated components of the academic advising matrix
Figure 1. Average effectiveness of advisee-induced factors.
The frequency of visits to academic advisor stands at 3.34 whereas the advisee’s awareness of responsibility is 3.23
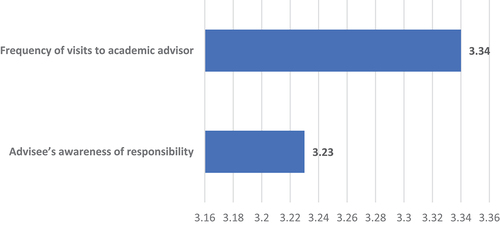
Table 5. Average and reliability of the advisee-induced factors
Table 6. Average and reliability of the advisee-induced factors
Figure 2. Average effectiveness of advisor -induced factors.
The highest ratio is 3.52 for Advisor’s knowledge about academic courses and the lowest ratio of 3.05 is for Advisor discusses my academic goals and progress.
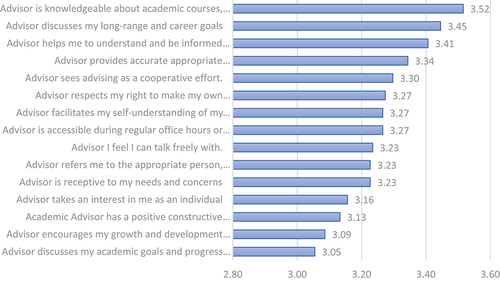
Table 7. Relationship between student performance and satisfaction with academic advising
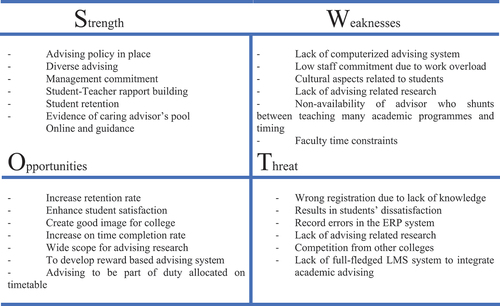
Figure 3. SWOT analysis for academic advising system.
Major strengths of the system include presence of an advising policy in place, student-teacher rapport building and student retention, whereas weaknesses of the system include lack of computerized advising system and low staff commitment to work overload. Further opportunities of the system include chance of increasing student retention rate and satisfaction, and advising to be included in the duty allocated on timetable. The major threats identified in the system include errors in ERP system, and lack of full-fledged LMS system to integrate academic advising. Table confirms that more than 70 percent of students are satisfied with the academic advising which helped to improve their grade point average (GPA).