Figures & data
Figure 1. A concept map that was used for teaching the topic of mitosis to students participating in a Biochemistry and Cell Biology course in the first year of a three-year biology bachelor in Norway. Each student was provided with a paper version of the concept map in A3 format (297 × 420 mm) and font size 12 (Figure S1, Supplementary Materials). Note the spelling mistake in exercise number four, where “depolarisation” should be “depolymerisation”. This mistake was clarified to the students orally.
Table 1. Part of a student survey for the evaluation of two teaching methods (classical lectures or concept maps) as well as related group work. Only the questions are presented. Section a and C were answered via a Likert scale (“Strongly disagree/Disagree/Neutral/Agree/Strongly agree”). Section B was answered via three options (“Lectures/Concept maps/No preference“, B.1), or freely via a text box (B.2). Section C follows a modified version of the survey by de Jong Gierveld and van Tilburg (Citation2006). The full survey is presented in Table S1 in Supplementary Materials
Figure 2. Final exam grades of first-year students joining biology and animal science bachelor programs as well as exchange students, in two consecutive years. In 2018, both question categories were taught via classical lectures. In 2019, one category was taught with topic-related concept maps, and the other via lectures. No significant changes were detected in student grades after the introduction of the concept map (p > 0.05).
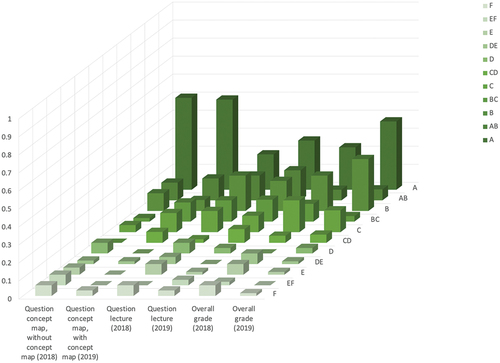
Figure 3. Answers to a student survey, examining perception of learning outcomes after working on two concept maps in the first year of a biology and an animal science programme, as well as an exchange students programme. Shown here are the survey questions related to perception of different levels of learning, as well as the acceptance of the teaching method by students. Asterisks indicate significantly more (p < 0.05) positive feedback (“Agree”/”Strongly agree”) than neutral or negative feedback (“Neutral”/”Disagree”/”Strongly disagree”) for the respective survey question.
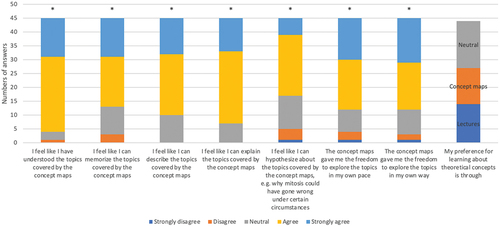
Figure 4. Word cloud based on answers to a student survey question: “Why did you prefer either the concept maps or lectures?”, with answers representing students who preferred lectures in blue (n = 12), answers representing students who preferred concept maps in red (n = 11), and answers representing students that did not prefer either teaching method in black (n = 8). Participants were mostly non-native English speakers, therefore, phrasing might be misleading.
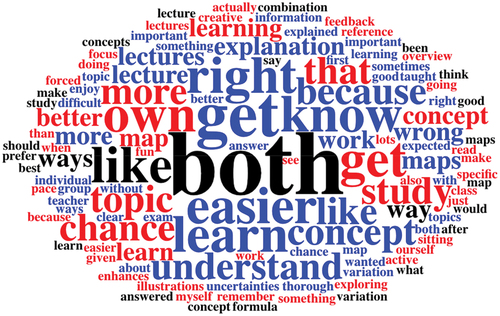
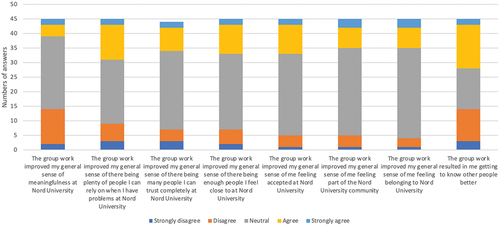
Figure 5. Student answers to a survey, examining their experience of working on two concept maps in the first year of a biology and an animal science programme, as well as an exchange students programme. The maps were filled out individually, followed by group work. Shown here are the survey questions related to the students’ feeling of loneliness in response to the group work. No significant positive effects were detected (all p > 0.05).