
Figures & data
Table 1. Participants’ demographic information
Table 2. Statistics of descriptive
Figure 1. Measurement model (Low order construct), SS= Stakeholder Support, AC= Activities done by academicians, R= Academicians Readiness, CT= Course Type, FP= Faculty members preparation, IES= IFRS Integration.
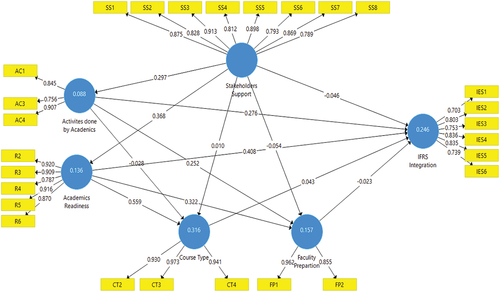
Table 3. Reliability and convergent validity analysis
Table 4. Correlations of discriminant validity
Figure 2. Structural Model - Hypotheses Testing Results, SS= Stakeholder Support, AC= Activities done by academicians, R= Academicians Readiness, CT= Course Type, FP= Faculty members Preparation, IES= IFRS Integration..
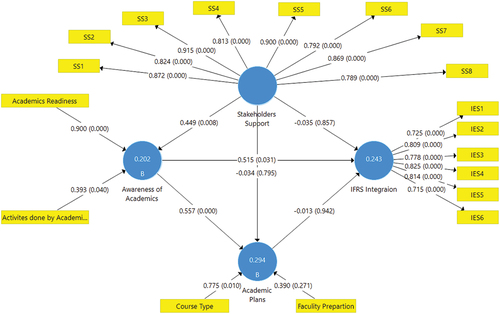
Table 5. Discriminant validity—HTMT
Table 6. Higher order construct validity
Table 7. Structural model – hypotheses testing
Table 8. Model goodness, predictive relevance, and model fit
Table 9. Prediction relevance of the model