Figures & data
Figure 1. Concept model of the study.
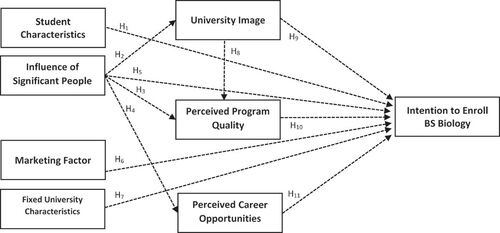
Table 1. Distribution of participants when grouped according to socio-demographic profiles (n = 416)
Table 2. Constructs of the scale with the items assigned and their corresponding references
Table 3. Model data fit indices results
Table 4. Convergent and internal consistency results of the scale
Table 5. Discriminant validity results
Table 6. Structural model estimates
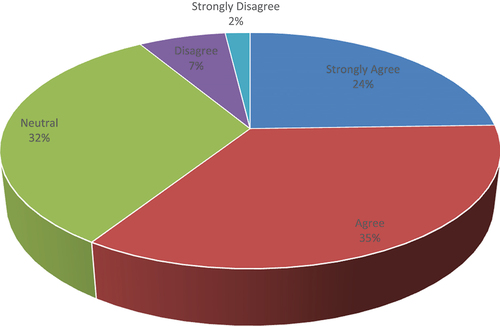
Figure 2. Distribution of students according to their intention to enroll in BS Biology at CTU (n = 416).