
Figures & data
Figure 1. Visualization of the conceptual framework for motivation of assessment.
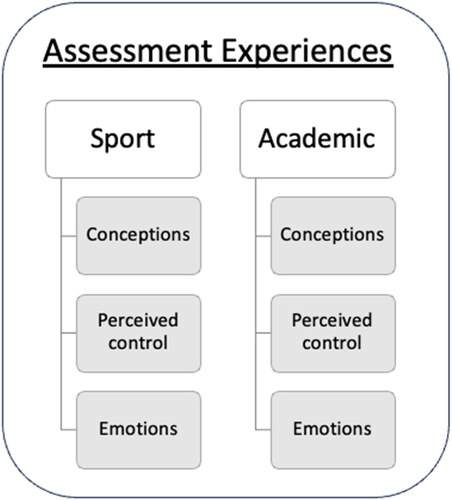
Figure 2. Visualization of the explanatory mixed-methods design.
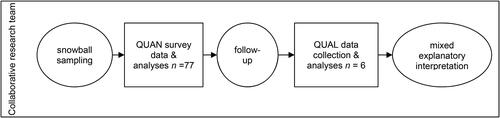
Table 1. Paired-samples t-tests.
Table 2. Description of qualitative participants (n = 6).
Table 3. Side-by-side joint display of mixed-methods interpretation.
Supplemental material
Supplemental Material
Download MS Word (21.4 KB)Data availability statement
Data can be made available at request. Data and plan of analysis have been pre-registered on the Open Science Framework.