
Figures & data
Table 1. Annual reporting requirement of DHET.
Table 2. Enrolment targets in APP for year n.
Table 3. Earmarked grants for year n.
Table 4. Cash flow projections of revenue and expenditure (three years).
Figure 1. Result hierarchy of the M&E logical framework model.
A symbolic plot of result level against time/milestone indicating the various incremental steps from baseline to impact.
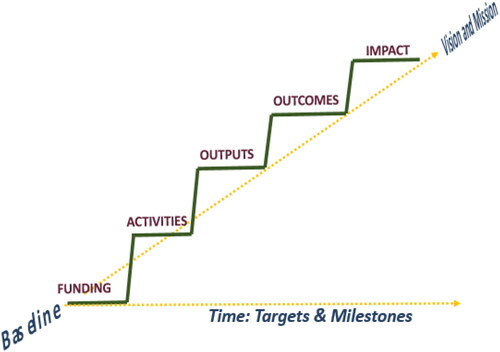
Figure 2. Understanding result level and theory of change.
A figure describing a logical relationship between result levels and theory of change indicating the logical links from the planning phase to long-time results.
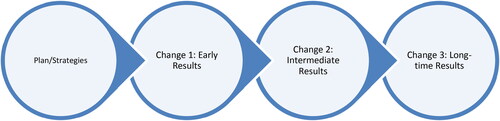
Figure 3. Analysis of counterfactual.
A figure describing the concept of counterfactual as an important consideration in assessing the actual contribution of academic interventions.
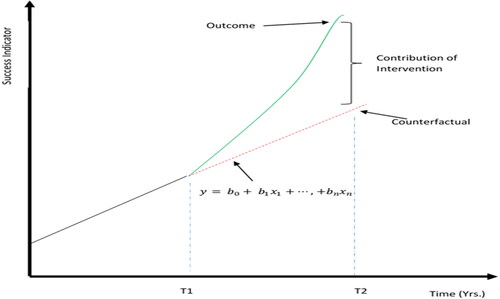
Figure 4. Hieratical result chain due to the TDG.
A figure describing the relationship between result levels and time following the use of earmarked funding (TDG) for academic interventions.
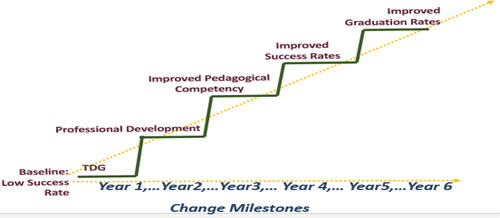
Figure 5. Problem analysis.
A figure describing the recommended approach to academic problem analysis from the underlying root causes of academic problems to the high level manifestation of the problems.
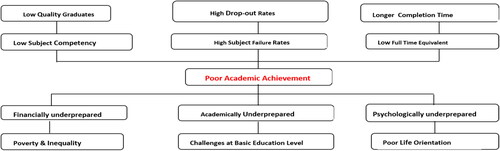
Table 5. Result-based planning & reporting framework.
Supplemental material