
Figures & data
Figure 1. Conceptual framework. Source: Authors’ construct.
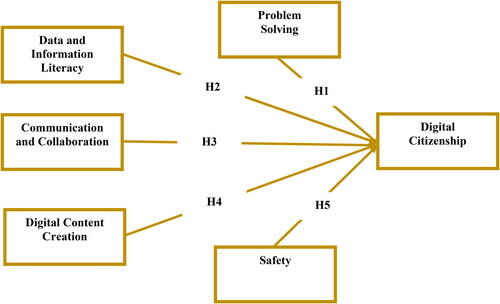
Table 1. Constructs, items, IL, CA (α), rho_A, CR and AVE.
Figure 2. PLS-SEM algorithm results.

Table 2. Fornell–Larcker.
Table 3. HTMT correlation ratios.
Table 4. Model fit indices.
Figure 3. PLS-SEM bootstrapping results.
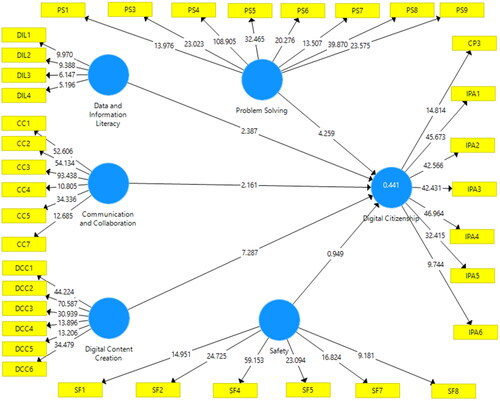
Table 5. Structural model.
Figure 4. Importance-performance map.
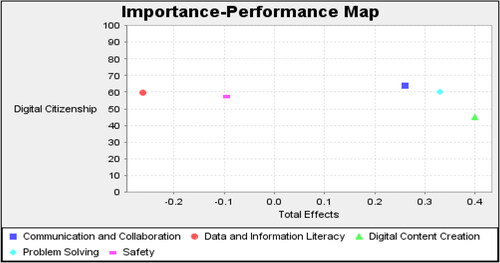
Table 6. Total effects and performance index values for digital citizenship.
Figure 5. Latent variable performances.
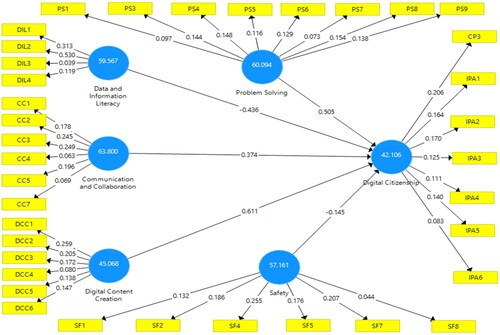
Figure 6. Revised conceptual framework. ***p < .001, *p < .05, NS = not significant. Source: Authors’ construct. 
 Non-significant path.
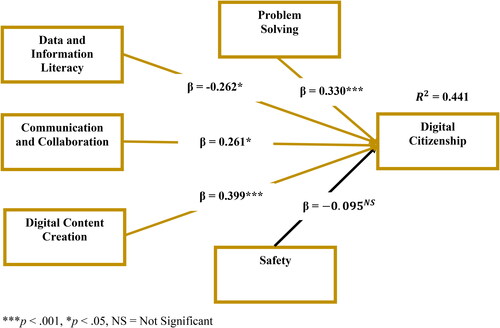
Table 7. Summary of results for the hypotheses.
Data availability statement
The data on which the findings and conclusions of the study are derived will be available upon request from the corresponding author