
Figures & data
Table 1. Summary of baseline characteristics using independent-samples t-tests with respective means and standard deviations for both groups.
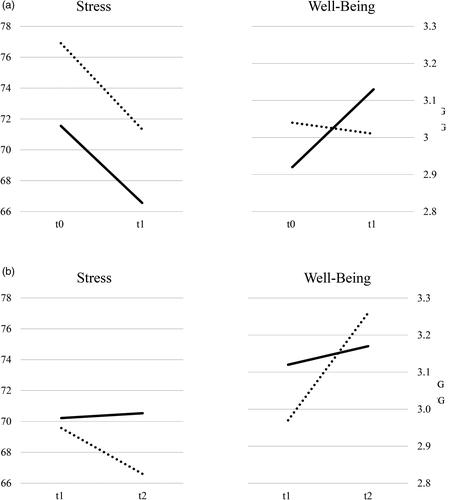
Figure 1. (a) Short-term effectiveness of the brief psychological intervention for study-related stress and well-being. Lines show students’ stress and well-being levels for baseline and post-measurement with respect to the intervention group (IG; n = 26) and control group (CG; n = 29). The time interval between t0 and t1 is one week. (b) Short-term effectiveness stability of the brief psychological intervention for study-related stress and well-being. Lines show students’ stress and well-being levels for post and follow-up measurement with respect to the intervention group (IG; n = 22) and control group (CG; n = 19). The time interval between t1 and t2 is one week. CG students received the intervention between t1 and t2.
Data availability statement
The dataset of this study can be obtained from the corresponding author upon request.