
Figures & data
Figure 1. Proposed EI abilities model.
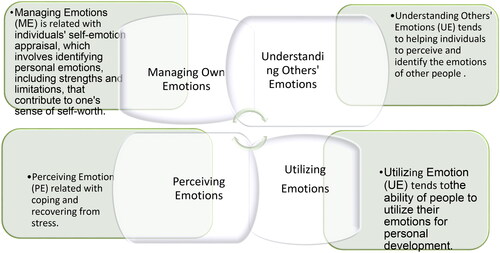
Table 1. Socio-demographic information of 11th-grade respondent students.
Table 2. Reliability and convergent validity (n = 176).
Figure 2. Conffirmatory factor analysis.
Note: F47 = ME, managing own emotions; F48 = UnE, understanding others’ emotions; F49 = UE, utilizing emotions; F50 = PE, perceiving emotions; F14-F46 = items of the questionnaire (refer to data collection instruments section).
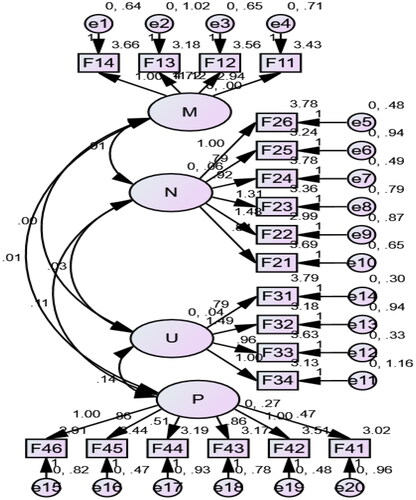
Table 3. Proposed levels of EI and frequency of distribution.
Table 4. Relationship between EI sub-scales and writing performance (n = 163) by Pearson correlation.
Table 5. Tests of between-subjects effects.
Table 6. The ANOVA statistics (df = 1,161; n = 163; male = 97 and female = 66).
Data availability statement
All data are available upon request from the editors and/or reviewers, and the corresponding author can provide them.