Figures & data
Table 1. The forms Equation 2 takes when there are 2, 3, 4, 5, or 6 components summing to variable Z, respectively
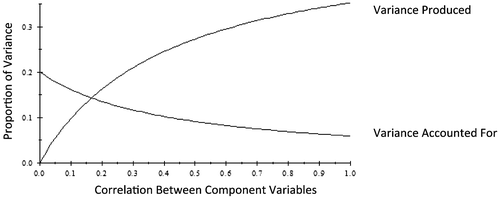
Figure 1. The decreasing curve describes proportion of variance accounted for by the favored variable as a function of the correlation among the component variables. The increasing curve describes the proportion of variance produced by the favored variable, including both its own variance term and the covariance terms to which it contributes, as a function of the correlation among the component variables.
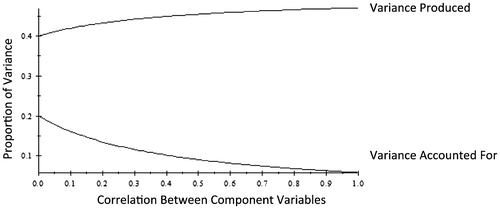
Figure 2. The decreasing curve describes proportion of variance accounted for by the favored variable as a function of the correlation among the component variables. The increasing curve describes the proportion of variance produced by all of the covariance terms to which the favored variable contributes (but not the favored variable variance term).